

Introduction to the Inside Bar Pattern
The inside bar is one of the most recognizable reliable patterns in use today. Famous for its easy visual representation of consolidation, this simple chart pattern can earmark the conditions for a profitable trade setup. This approach relies on the concept of price action, focusing on the analysis of individual candlestick patterns to identify potential trading opportunities. In this article, we will explore the various aspects of the inside bar pattern, from mother candle to bullish reversal, and share expert tips to enhance your trading performance with the profitable inside bar setup.
The Inside Bar Pattern: Definition and Identification
The inside bar pattern should be considered a valuable tool in the world of price action trading, offering valuable insights into potential trading opportunities. Before we dig into the details of the inside bar pattern, it's essential to have a clear understanding of what an inside bar is and how to identify it on a price chart. In this section, we will define the inside bar pattern and guide you through the process of spotting this unique formation in various markets.
What is an Inside Bar Pattern?
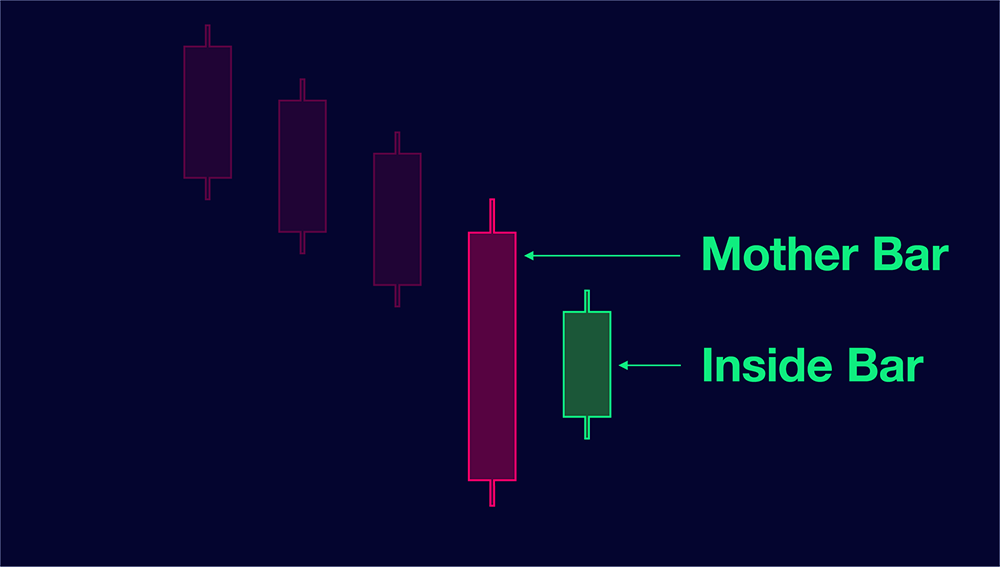
An inside bar is a classic bar candlestick pattern that occurs when a particular candle, known as the "inside bar," is completely contained within the range of the previous candle, referred to as the "mother bar" or "mother Candle". In other words, the inside bar's high is lower than the mother candle's high, and its low is higher than the mother candle's low. The mother bar is the larger candle. This pattern indicates a period of consolidation, where the market is being indecisive. As the balance between buyers and sellers is relatively equal price simply maintains a steady level.
Inside bars are commonly used in technical analysis to signal potential trend continuation or reversal setups. They can be observed on the daily chart time frame, or any intra-day timeframes, and across many financial markets, including stocks, commodities, cryptocurrencies, and forex trading strategies. When an inside bar trade pattern is identified you can use it to make better decisions about entering or exiting a trade. Be sure to keep in mind the overall market conditions and the direction of the breakout from the inside bar following its period of consolidation. As you will learn, breaking the inside bars range can often result in a bullish candle continuation pattern.
LEARN MORE: Check out our Entries & Exits Course!
Identifying Inside Bar Patterns
Identifying inside bars on price charts is an essential skill for traders using this strategy. To help you spot these patterns with ease, we have prepared a guide on how to recognize inside bars on price charts:
- Choose your market and timeframe. Inside bars can be found across various markets, including forex, stocks, commodities, and cryptocurrencies. An inside bar develops on different timeframes, such as daily time frame, hourly, or even minute chart. Select the market and timeframe you wish to analyze based on your trading style and preferences.
- Familiarize yourself with candlestick charts. Ensure you have a good understanding of candlestick charts and how to read them. Candlestick charts display the open, high, low, and close prices for each time period, with the body of the candle representing the difference between the opening and closing prices, and the wicks (or shadows) representing the high and low prices.
- Scan the chart, look for a prominent previous bar known as the mother bar, which will serve as a reference point for identifying the inside bar. The mother bar should have a relatively large range compared to the surrounding candles.
- Once you've located the mother bar, search for a subsequent candle that is entirely contained within its trading range. This means the inside bar's high should be lower than the mother bar's high, and its low should be higher than the mother bar's low. This smaller candle is the inside bar.
- Take the time to confirm the pattern by double-checking that the inside bar is fully contained within the range of the mother bar. Being contained within the mother bar represents a consolidation phase. Occasionally, traders might encounter near-inside bars, where the highs or lows are almost equal but not fully contained. These should be approached with caution, as they may not provide the same level of reliability for price movement or price volatility.
- Finally, monitor the price action following the inside bar pattern, which may indicate a potential breakout in either direction. If the price breaks above the high of the mother bar signals buying pressure and a possible bullish move, whereas if the price breaks in the opposite direction, below the low of the mother bar, suggests a potential bearish move. The inside bar is not without false signals, so caution is always warranted.

Inside Bar Trading Strategies
Understanding price action strategies is crucial for traders because it forms the foundation of technical analysis. Price action trading focuses on the movement of an asset's price over time, allowing traders to identify trends, reversals, and potential trading opportunities. The inside bar is one such price action strategy that can provide valuable insights into market behavior and direction.
It is important to note that this article only covers the basics of inside bar strategies. Traders have developed a significant number of advanced strategies using inside bars to recognize and trade potential reversals, and bearish patterns, and better recognize current trend reversals.
The Bullish Break
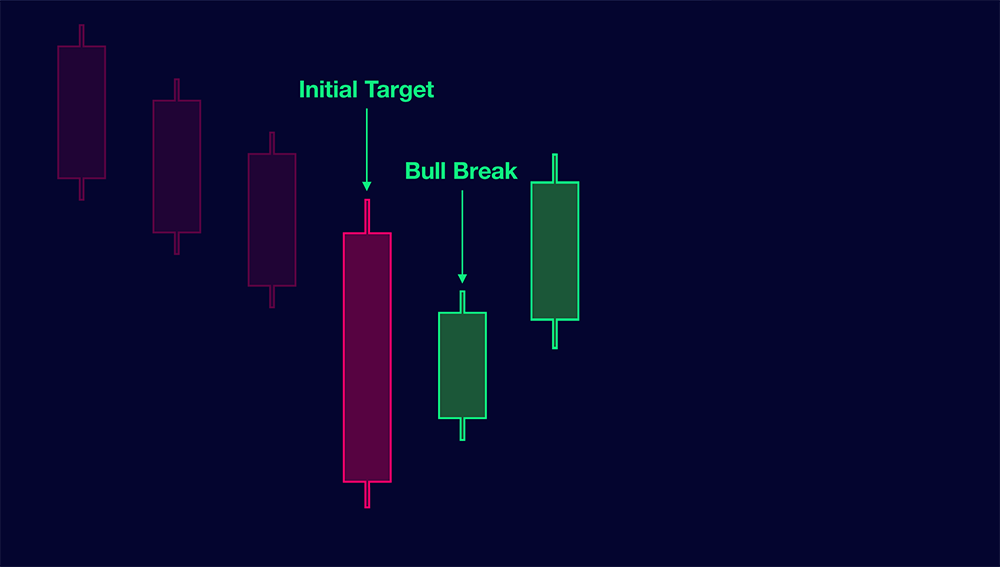
Once the mother bar forms, setting the range for our inside bar, watch for the close of your inside bar to form. This confirms the consolidation phase has elapsed and there is a relative pause in price action. The key levels to recognize for the bullish candle pattern are the high of the inside bar and the high of the mother bar.
As the price action continues, watch for any signs of buying pressure in the current candle, that being the candle following the close of the inside bar. Should the market equilibrium give way to buying pressure the most important level to break is the inside bar high. Once this prior consolidation resistance is broken the Inside Bar can be considered to be in a bullish breakout. The target for this breakout is the high of the previous candlestick. As price moves within the range be cautious about the potential for a reversal pattern to form.
The Bearish Break
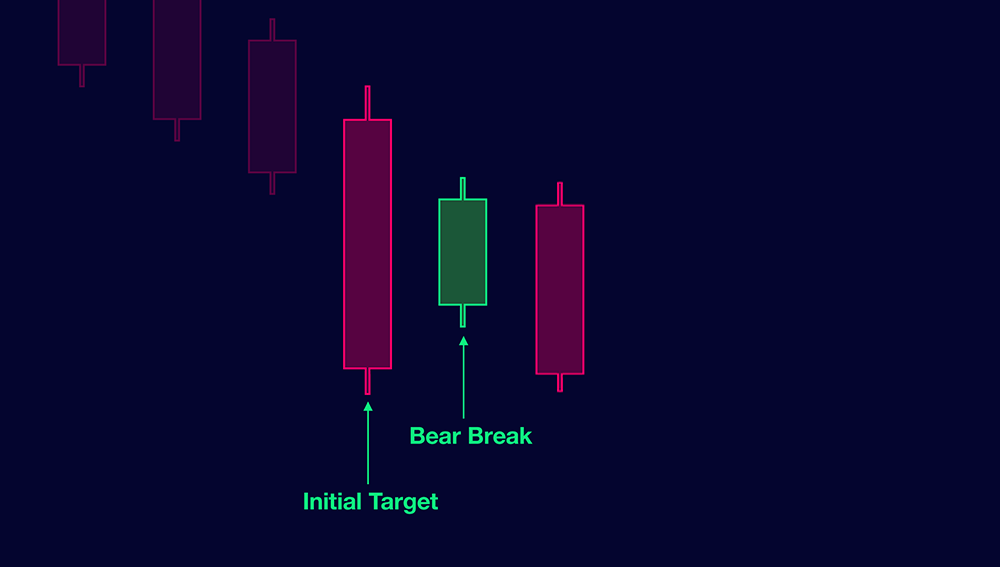
The formation of the bearish break pattern follows the same process as the bullish breakout strategy. The major difference between the two setups is that we are looking for weakness. Following the choppy market action of the inside bar, we closely monitor the lows of the inside bar candle. Once this candle breaks this low consider the inside bar active and the target for this potential trade is the low of the previous candlestick. Should this bearish candle close under the inside bar low it is at less risk of reversal. Always, be wary of short positions as they can face significant potential losses.
Bearish Reversals & Bullish Reversals
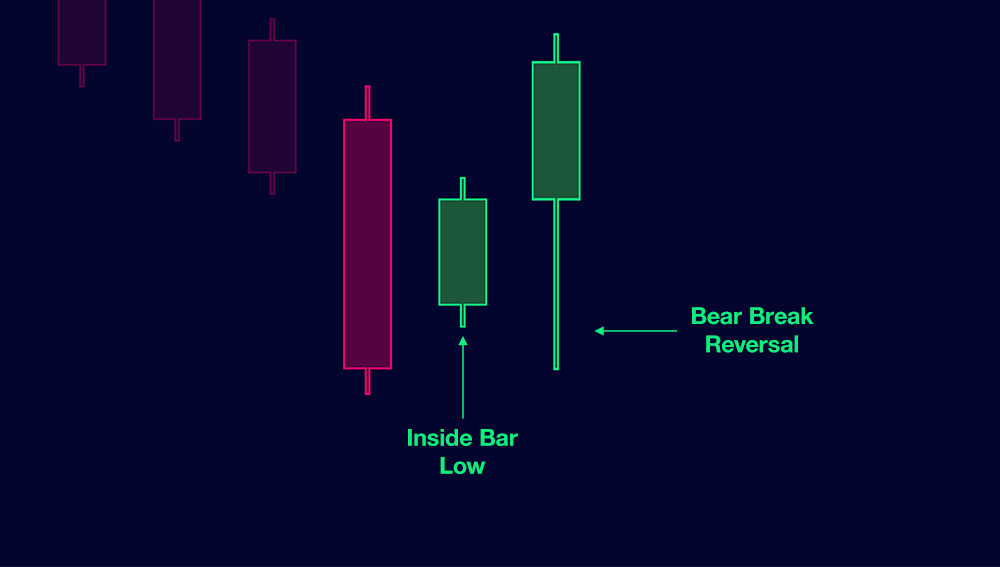
Once our inside bar has formed we must consider the fact that market reversals can occur on any timeframe. Therefore we may encounter a scenario where the high or low of our inside bar breaks, but the price action lacks the strength to close above that key level. This can be considered a failed breakout and such reversals can see a significant shift in market sentiment. This is because an attempt at directionality was made, and failed, and the market has now lost confidence in that break and looks for action in the opposing price range.
For this reason, it is often advised to maintain strict risk management practices when trading even the most basic inside bar strategies. One popular strategy is to buy the inside bar break and immediately set your stop. Next, assuming the price action continues as your thesis intended, move your stop to the high or low of the inside bar. This basic trade management strategy can prevent you from being trapped in an inside bar.
Expert Tips For Inside Bar Trading
To maximize your success when trading inside bars, consider these expert tips and strategies that can help you make more informed decisions and minimize risk:
- Trade in the direction of the trend: The probability of a successful trade increases when you trade inside bars in line with the prevailing market trend. Identify the trend (upward or downward) and look for inside bar patterns that support the trend's continuation.
- Consider the context: By analyzing the broader market context and trend direction before entering a trade based on an inside bar pattern. Factors such as key support and resistance levels, market sentiment, and news events can influence the success of your trade
- Look for confluence: Look for the presence of multiple technical factors that support your trade decision. When trading inside bars, look for additional confirmation from other technical indicators, such as moving averages, Fibonacci levels, or trendlines.
- Be patient and wait for confirmation: Instead of entering a trade immediately after spotting an inside bar, wait for confirmation through a breakout from the pattern.
- Use risk management techniques: Consider setting stop-loss orders and managing your position size. This will help protect your capital and minimize the impact of unsuccessful trades.
- Consider your risk tolerance: Evaluate the potential risk-to-reward ratio. Ideally, the potential reward should be at least twice the risk, ensuring that even if some trades are unsuccessful, your overall trading performance remains profitable.
- Practice identifying inside bars: Paper trade on multiple timeframes to develop a better understanding of how the pattern behaves in different market conditions. Inside bars can appear on various timeframes, from daily to intraday charts.
- Have an exit strategy in place: Planning your exit strategy is crucial when trading inside bars. Determine your exit price based on factors such as key support and resistance levels, and be prepared to exit if the trade doesn't go as expected. This will help protect your potential profits and prevent losses.
By incorporating these expert tips and strategies into your trading approach, you can enhance your decision-making process, increase the probability of successful trades, and minimize risk when trading inside bars.
Putting it All Together for Successful Inside Bar Trading
Inside bar trading is a simple and versatile trading strategy that can be applied across various financial markets and timeframes. It allows even novice traders to identify potential trend continuations and reversals and manage risk effectively with clear stop-loss placement. However, it is important to be aware of the challenges, such as false breakouts, subjectivity in pattern identification, reliance on other factors, and variable success rates.
To maximize the benefits and minimize the drawbacks of inside bar trading, traders should combine this strategy with other technical analysis tools, practice proper favorable risk management, and gain experience in identifying high-probability setups. By doing so, traders can effectively use inside bars as a valuable component of their overall trading arsenal, helping them capitalize on various market situations and potentially improve their trading performance.
