

What is a Trend Line?
When you start learning to trade you will almost immediately run into a discussion on trend lines. Trend lines are among the most powerful and widely used tools to navigate the markets. They help traders analyze their price chart and identify potential areas of support and resistance, providing valuable insights into the underlying market trends. An understanding of trendlines is crucial for both novice and experienced traders looking to make informed decisions about price action and increase their chances of success.
A trend line is a core foundational tool that serves as a visual representation of the prevailing market trends. It does this by connecting a series of significant points on a chart and helps determine the presence of a chart pattern. Typically drawn as straight lines, trendlines highlight the direction and the speed of price movements, helping you to identify and understand the underlying market psychology. When we connect peaks or troughs, we use trendlines to establish data points that help with making decisions about buying, selling, or holding a financial instrument. As the price moves along a straight line, these support and resistance levels can provide insights into potential entry and exit points. Lastly, trend lines play an important role in determining false breaks, trend reversals, or continuations, allowing you to anticipate future price actions and adjust your strategies accordingly.
LEARN MORE: What is Technical Analysis?
Definition of a Trend Line
A Trend Line is a straight line drawn on a stock chart connecting a series of points to indicate the prevailing price trends of a financial instrument. In more basic terms, trend lines involve connecting a series of prices on a chart to reveal the general direction of stock price movements. This provides a visual representation of the overall trend or the presence of a chart pattern.
Trend Lines can be used for:
- Connecting candlestick highs and lows to visualize direction
- Assessing market psychology and sentiment to determine potential future price action
- Establish potential support and resist levels
- Identifying trends on many timeframes and asset types
- Determining major shifts in price action behavior
What is a Trend Line in Technical Analysis?
Understanding trend lines in technical analysis is critical for traders as these lines provide valuable insights into the underlying market psychology. By identifying price movement, trend lines help traders identify areas of support and resistance, which are essential in determining potential entry and exit points for their trades. As a core component of technical analysis, trend lines allow traders to monitor price trends on a price chart, anticipate potential trend reversals or continuations, and adjust their strategies accordingly.
Predicting Future Price Movements
Trend lines can be useful in predicting future price movements by providing a visual representation of the market's direction and the prevailing sentiment. By drawing parallel lines, one can identify patterns like an ascending or descending trend channel to anticipate potential trend reversals or continuations. While a linear trendline cannot predict future price chart movements with absolute certainty, they offer a framework for understanding market behavior and gauging the likelihood of certain price actions.
Trendline Support and Resistance Levels
Trend lines help identify support and resist levels by creating a visual representation of the market's overall direction, highlighting areas where the price has historically struggled to move beyond. In an uptrend, the trendline represents a support level, where buyers tend to enter the market, driving prices higher. In a downtrend, however, the trendline serves as a resistance level, where sellers tend to dominate, pushing prices lower.
Assessing Trend Strength
Trendlines are instrumental in assessing trend strength, and more importantly, the likelihood of an existing trend's ability to continue along its trajectory. Linear trendlines reveal the steepness of the trend, which can provide insights into the strength of the underlying bullish or bearish sentiment. A steeper trendline may indicate a strong trend, with higher conviction from market participants, while a flatter trendline may suggest a weaker trend with less conviction, more akin to a typical support and resistance level. Additionally, the number of touches or retests of the trendline can serve as a proxy for trend strength, with more touches often signifying a more robust trend.
Different Types of Trendlines
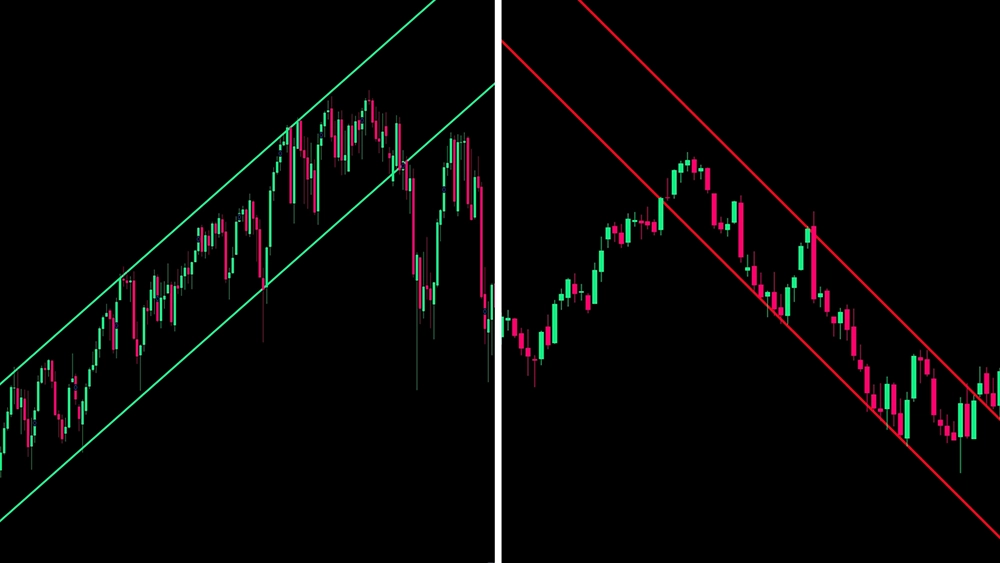
Trendlines come in various forms and each type provides valuable information for making informed decisions. The three main types of trendlines are horizontal, ascending, and descending. Horizontal trendlines represent a range-bound market, where neither buyers nor sellers have control, and the price oscillates between support and resistance levels. Ascending trendlines, on the other hand, indicate uptrends, where buying pressure pushes prices higher, creating higher lows along the trendline. Descending trendlines signify downtrends, with selling pressure driving prices lower and forming lower highs.
Horizontal Trend Lines
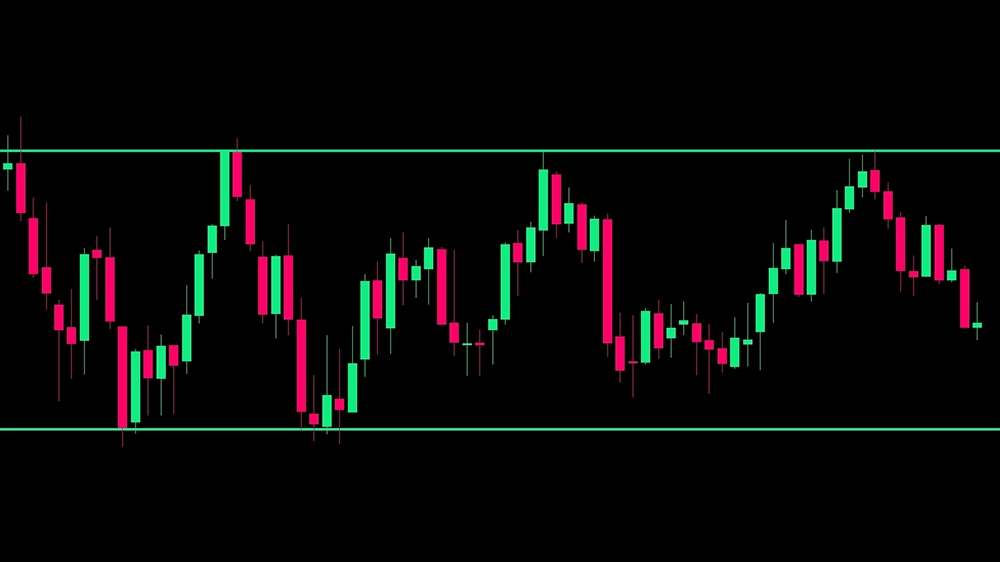
Horizontal trendlines are straight lines representing a range-bound market, where neither buyers nor sellers have clear control. In this environment, the price tends to move sideways between established support and resistance levels. The horizontal trendline is drawn by connecting each significant closing price at either the lows or the highs of the price action. This highlights areas where the price has repeatedly struggled to move beyond. These trendlines provide insights into the market's equilibrium state, where bulls and bears are evenly matched. Traders can capitalize on horizontal trendlines by identifying potential trading opportunities at the support and resistance levels, anticipating price reversals, and employing range-bound trading strategies.
Identifying Range-bound Markets
Trendlines are particularly useful in identifying range-bound markets, where the price moves sideways between established support and resist levels. Horizontal trendlines are drawn by connecting at least two price points, highlighting areas where the price consistently struggles to break through. These trendlines offer traders insights into the market's equilibrium, where neither buyers nor sellers dominate. In the example below we can see that the price action has established and struggled with a very defined range, marked by the horizontal trendlines.
Potential Breakout Levels
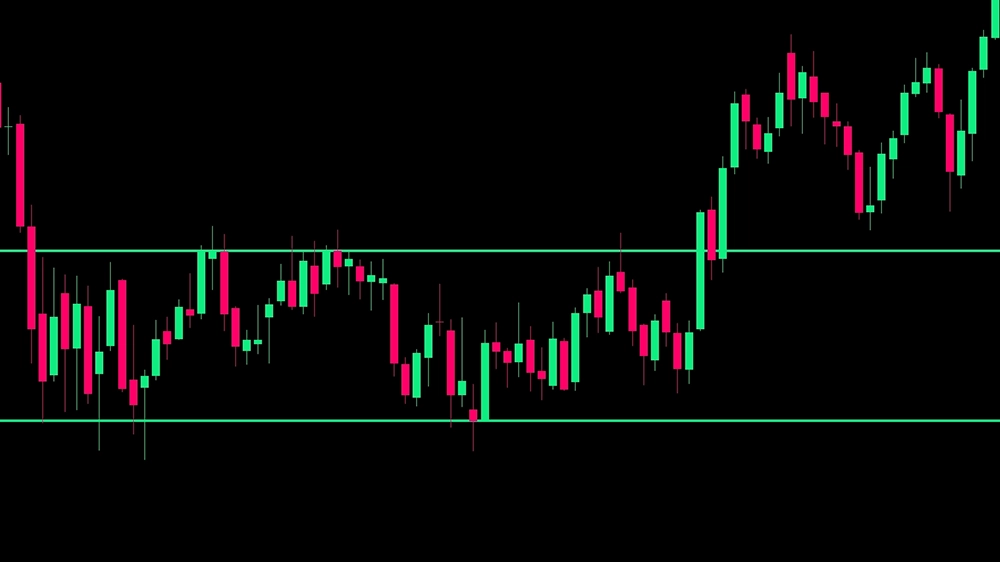
Horizontal trendlines also serve as an essential tool for identifying potential breakout levels. These linear trendlines indicate where the price breaks through established support or resistance levels and begins a new trend. By recognizing the horizontal trendline's position to the current market price, traders can anticipate potential breakouts and adjust their strategies accordingly. A breakout above a resistance level may signal a bullish sentiment, indicating a buying opportunity, while a breakdown below a support level may indicate a bearish sentiment, leading to selling opportunities. This trendline data can be used to mark parallel trendlines and help traders identify when a price channel occurs. In the example below we can see the price breaking above an established horizontal trendline, and following through on a breakout.
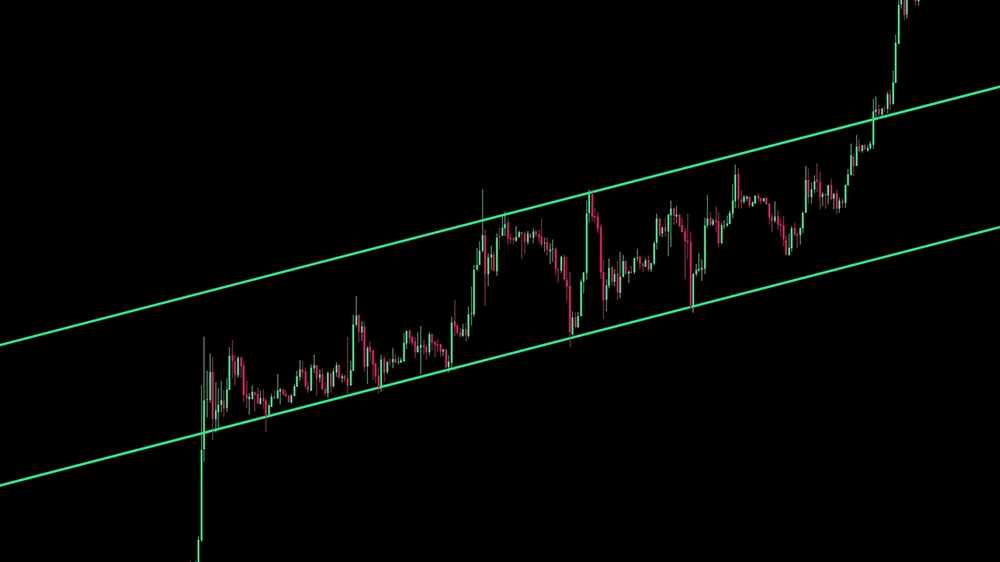
Ascending Trend Lines
Ascending trend lines are a type of uptrend line that with a positive slope signifies an uptrend, where buying pressure pushes prices higher, creating higher lows along the trendline. We've all heard the chant Higher Lows, Higher Highs! That is another way to think about trendlines. The uptrend lines are drawn by connecting points along the lower end of the chart, highlighting the series of higher lows, which serve as support levels. As the trend line continues to move upward, it serves as a reliable support level for traders to assess potential buying opportunities. Traders can use the ascending trend line to gauge the strength of the uptrend and anticipate potential buying opportunities.
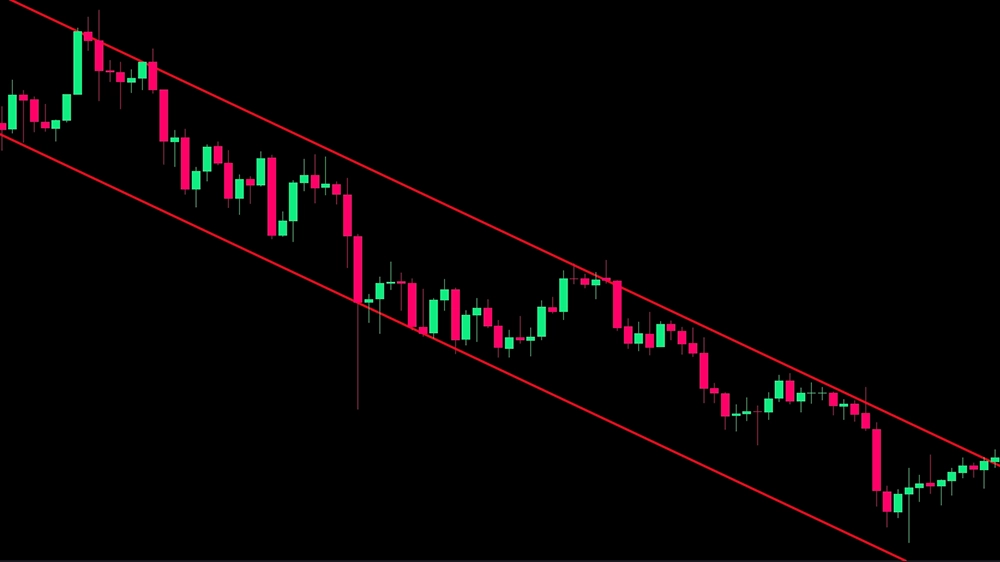
Descending Trendlines
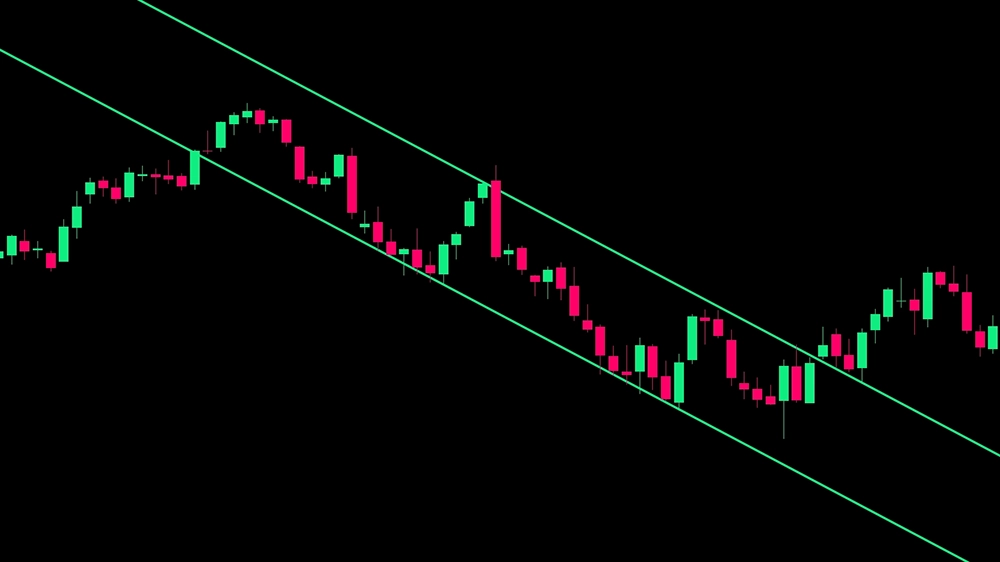
Descending trend lines are a type of negative slope trend line that indicates where selling pressure drives prices lower and creates lower highs along the downtrend line. The negative slope is drawn by connecting price points along the upper end of the chart, highlighting the series of lower highs, which serve as resistance levels. A downtrend line offers traders insights into the market's bearish sentiment. As the trend line continues to move downward, it serves as a reliable resistance trend line for traders to assess potential selling opportunities. Traders can use the descending trend line to gauge the strength of the downtrend and anticipate potential selling opportunities, such as when the price tests the trendline's resistance levels. Selling at or near the trendline's resistance level offers traders an opportunity to enter the market at a higher price and potentially profit from a further move lower along the trend line.
Trend Line Drawing Techniques and Best Practices
Drawing trendlines correctly is important for accurate technical analysis and profitable trading. Trendline drawing techniques and best practices include identifying important price points, selecting the correct timeframe, and using other technical indicators to confirm the trendline's validity. It's important to use a chart that is clear and easy to read, with enough price action to identify highs and lows. When drawing trendlines, traders should connect at least three points on the chart to confirm the trendline's validity and a third point for confirmation. The trendline should then be extended to the right of the chart to identify potential future support or resistance levels. It's also important to periodically re-evaluate trendlines to ensure their accuracy and adjust them as necessary. Traders should use other technical indicators, such as moving averages and oscillators, in conjunction with trendlines to confirm trading decisions and avoid making decisions based solely on trendline analysis.
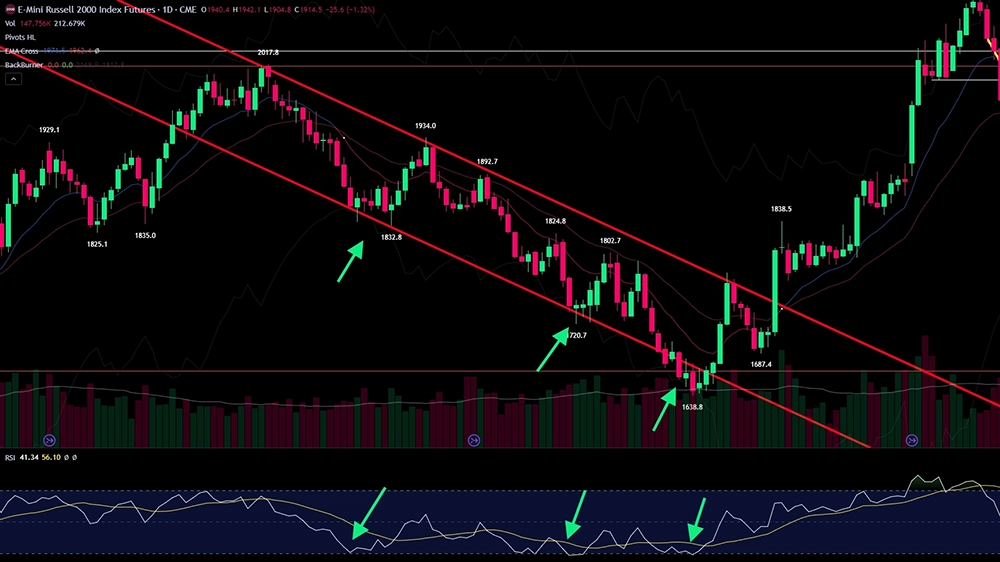
Using Trendlines with Other Technical Indicators
Using trendlines with other technical indicators can improve accuracy. One popular technical indicator to use with trendlines is the moving average, which can help confirm the trendline's direction and provide additional support or resistance levels. Oscillators, such as the Relative Strength Index (RSI) and Stochastic Oscillator, can also be used to confirm the trendline's validity by identifying overbought and oversold conditions. Traders can also use chart patterns, such as triangles and head and shoulders patterns, in conjunction with trendlines to identify potential breakout or breakdown opportunities.
Adjusting Trendlines Over Time
Adjusting trend lines over a given time period is an important best practice to ensure their accuracy and relevance. It is good to occasionally review whenever new price action emerges or when the market conditions change. For instance, if the market shifts from a range-bound to a trending market, a trader needs to adjust their trendlines to match the new market conditions. By adjusting the trendlines over time, traders can avoid making trading decisions based on outdated or irrelevant trendlines. Additionally, traders can use other technical indicators, such as moving averages and oscillators, to confirm the trendline's validity and improve the accuracy of their trading decisions. By following these best practices, traders can use trendlines effectively in technical analysis and develop profitable trading strategies.
Trading Strategies with Trendlines
A trendline can be a valuable technical analysis tool for developing trading strategies. One popular approach is to use trendlines to identify support and resistances, which can be used to set stop-loss and take-profit orders. By placing stop-loss orders below the trendline in uptrends or above the trendline in downtrends, traders can limit their potential losses in case the trend reverses. Traders can also use trendlines to identify breakout and breakdown levels, which can indicate potential trading opportunities. Additionally, trendlines can be used to identify trend reversals, which can signal a shift in market sentiment and the potential for profitable trades
Supports and Resistances
Trendlines can be used to identify support and resistance, which can be used as part of a trading strategy. In an uptrend, the trendline acts as a support level, and traders can enter a long position when the price bounces off the trendline. Traders can place stop-loss orders below the trendline to limit their potential losses if the trend reverses. In a downtrend, the trendline acts as a resistance level, and traders can enter a short position when the price is rejected from the trendline. Traders can place stop-loss orders above the trendline to limit their potential losses if the trend reverses. By using trendlines to identify key points, traders can develop trading strategies with clear entry and exit points.
Stop Loss and Take Profit Placement
Trendlines can be used with stop-loss and take-profit orders to manage risk and maximize profit potential. In an uptrend, traders can place a stop-loss order below the trendline to limit their potential losses if the trend reverses. Take-profit orders can be placed at a predetermined level above the trendline, which provides a clear profit target. In a downtrend, traders can place a stop-loss order above the trendline and a take-profit order at a predetermined level below the trendline. By using trendlines with stop-loss and take-profit orders, traders can manage their risk and maximize their profit potential. It's important to note that stop-loss and take-profit orders should be placed based on the trader's risk tolerance, trading style, and market conditions. Traders should also periodically re-evaluate their stop-loss and take-profit levels and adjust them accordingly to reflect any changes in market conditions or price action.
Breakouts and Breakdowns
Trendlines can also be used to identify trend line breaks and breakdown levels, which can be used as part of a trading strategy. In an uptrend, trendline breaks occur when the price breaks above the trendline, which can indicate a potential buying opportunity. Traders can enter a long position when the price breaks above the trend line and place a stop-loss order below the breakout level. Similarly, in a downtrend, a breakdown occurs when the price breaks below the trendline, which can indicate a potential selling opportunity. Traders can enter a short position when the price breaks below the trend line and place a stop-loss order above the breakdown level.
Conclusion: Mastering Trendlines for Trading Success
In this article we have tried to answer the question "What is a trendline?" and hope we have conveyed that trend lines are a fundamental tool in technical analysis that can help traders identify trends, key levels and potential breakout and breakdown points. While trendlines can provide valuable insights into market dynamics, it is important to use them in conjunction with other technical indicators and to adjust them over time to reflect changing market conditions. Traders should also be aware of the limitations and subjectivity of trendline analysis and be consistent in their approach to avoid common mistakes. By incorporating trendlines into their trading strategies and continually learning and improving, traders can gain an edge in the market and make more informed trading decisions.

