The TCG BackBurner indicator takes advantage of the first major counter-trend reaction following a strong breakout or breakdown, and helps identify price levels most likely to mark a higher low or lower-high on a higher timeframe.
By factoring in multi-timeframe analysis, directional momentum, and short-term volatility, the BackBurner simplifies a complex trading scenario.
With the BackBurner indicator, traders can make confident entries, while still prioritizing risk management.

-
The Best Indicator
 This indicator takes the guesswork out of oversold bounces. Now I know the difference between best conditions and dead cat bounces. I cannot recommend it enough and it paid for itself in one trade.
 -
Unbelievably helpful
The Backburner gives me the confidence to jump into a trade without having to spend extra time double checking other timeframes which lets me get into the trade sooner and make the most of the setup. -
Amazing Time-Saver
I've been trading with TCG for years and I am no stranger to the Back Burner strategy. I know I can find these setups myself but having this indicator take the guesswork out of the equation has freed me up for more complex analysis and saves me time.
What is the TCG BackBurner Indicator?
How often have you been staring at your chart watching a huge trend reversal play out but lacked the confidence to make an entry?
You're not alone. Despite the mantra "Buy The Fear" it can be stressful trying to play oversold bounces and make entries that play counter to the trend. As traders we always want to take advantage of liquidity and momentum, but we don’t want to do so at the expense of risk management.
The BackBurner strategy takes advantage of the first major countertrend pullback/breakout. In many cases these price movements contribute to the formation of highs and lows on larger timeframes. This works because once a ticker sees a significant directional move, there is a much higher probability of a counter reaction at the first overbought or oversold level it encounters. The BackBurner indicator factors in timeframe analysis, overall directional momentum and short term volatility to identify those oversold levels most likely to benefit from this type of reaction.
The strategy can be modified for any timeframe, but is optimized for the 5 minute and hourly time frame. For the 5 min timeframe, the ideal outcome would be that the first 5 min oversold conditions will mark an hourly higher low. For the hourly timeframe, the ideal outcome would be that the hourly oversold conditions would mark a daily higher low. In short, the BackBurner indicator simplifies a complex trading scenario and can help you quickly identify and profit from particularly powerful market conditions.

Chart Guys Indicator Features
Lifetime Access
Automatic Updates
Made for TradingView
Real-Time Alerts

Case Studies
See the BackBurner Indicator in action...
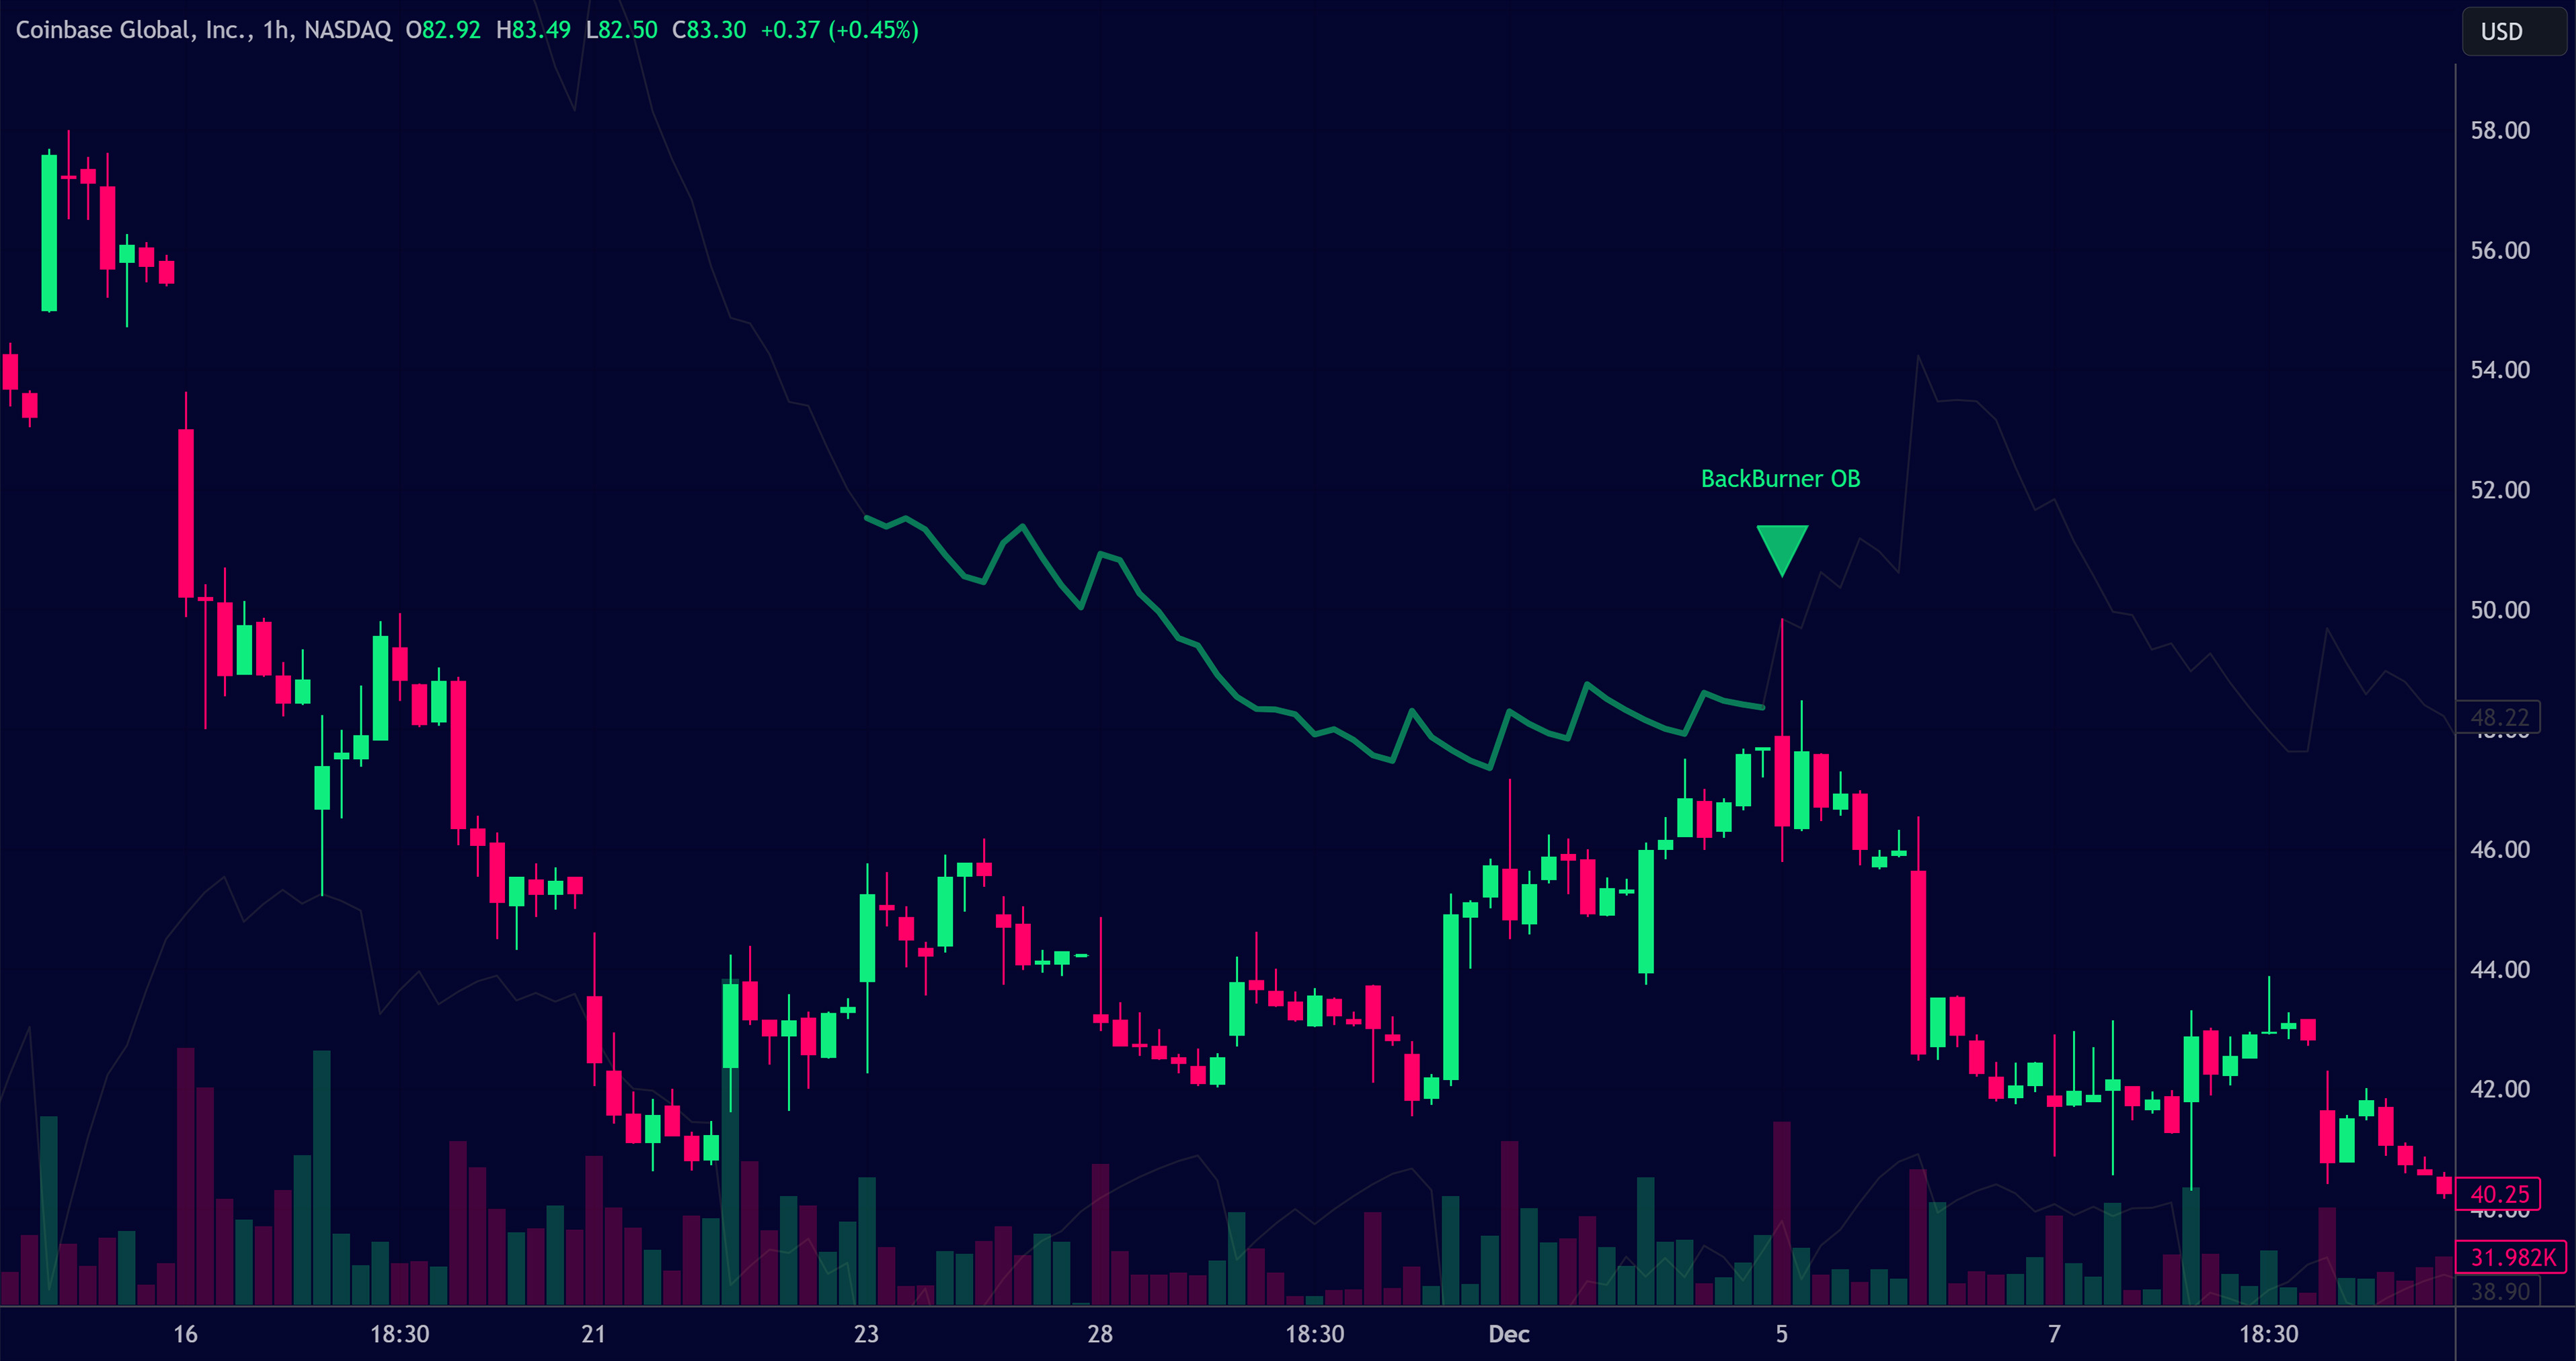
COIN
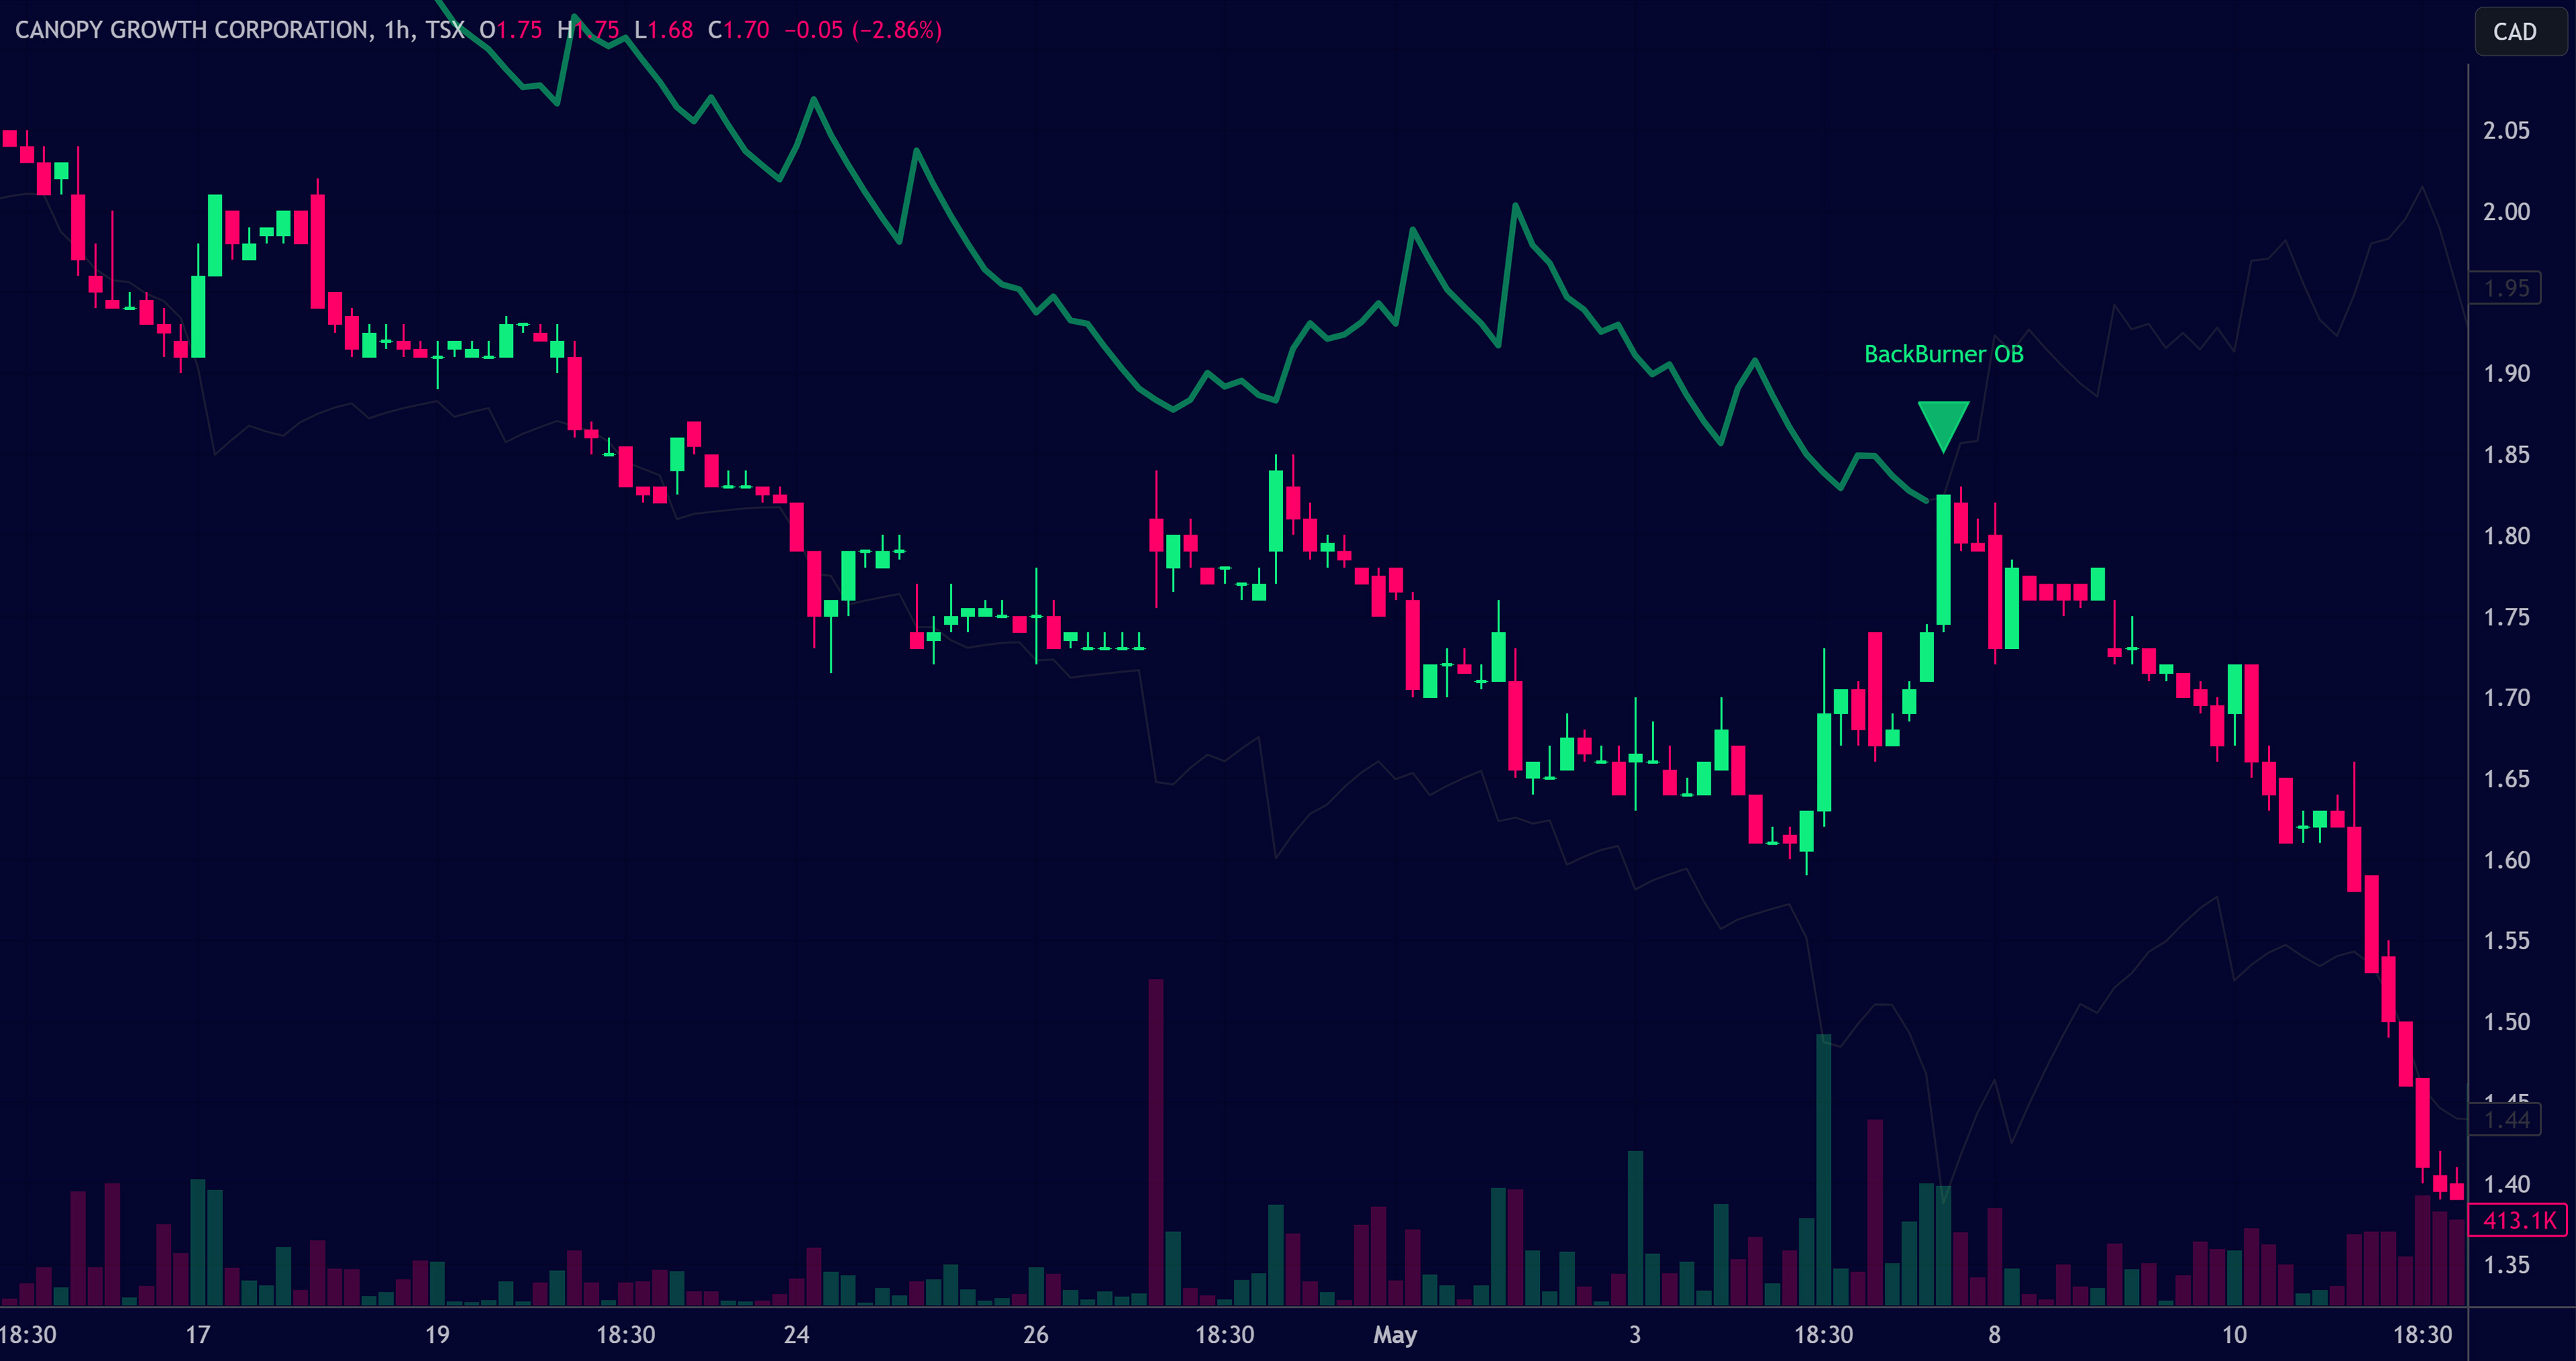
In this example we see COIN indicating a BackBurner Overbought alert. As with many executions of the BackBurner strategy we first see a steady climb on the hourly timeframe with a strong bullish uptrend with higher lows on each period of consolidation. Without having to examine the larger timeframes above (namely the 4 hour and daily) the green BackBurner line above the price tells us that this recent bullish strength is moving against the market, and the prevailing trend is bearish. At this point aggressive shorts are stalking entries. Knowing that any significant upside deviations away from price would be far overextended short players have confidence entering a position on the trigger of the BackBurner overbought conditions. In this case we can see the overextension resulted in a collapse and resumption of the overall downtrend and a profitable short trade.
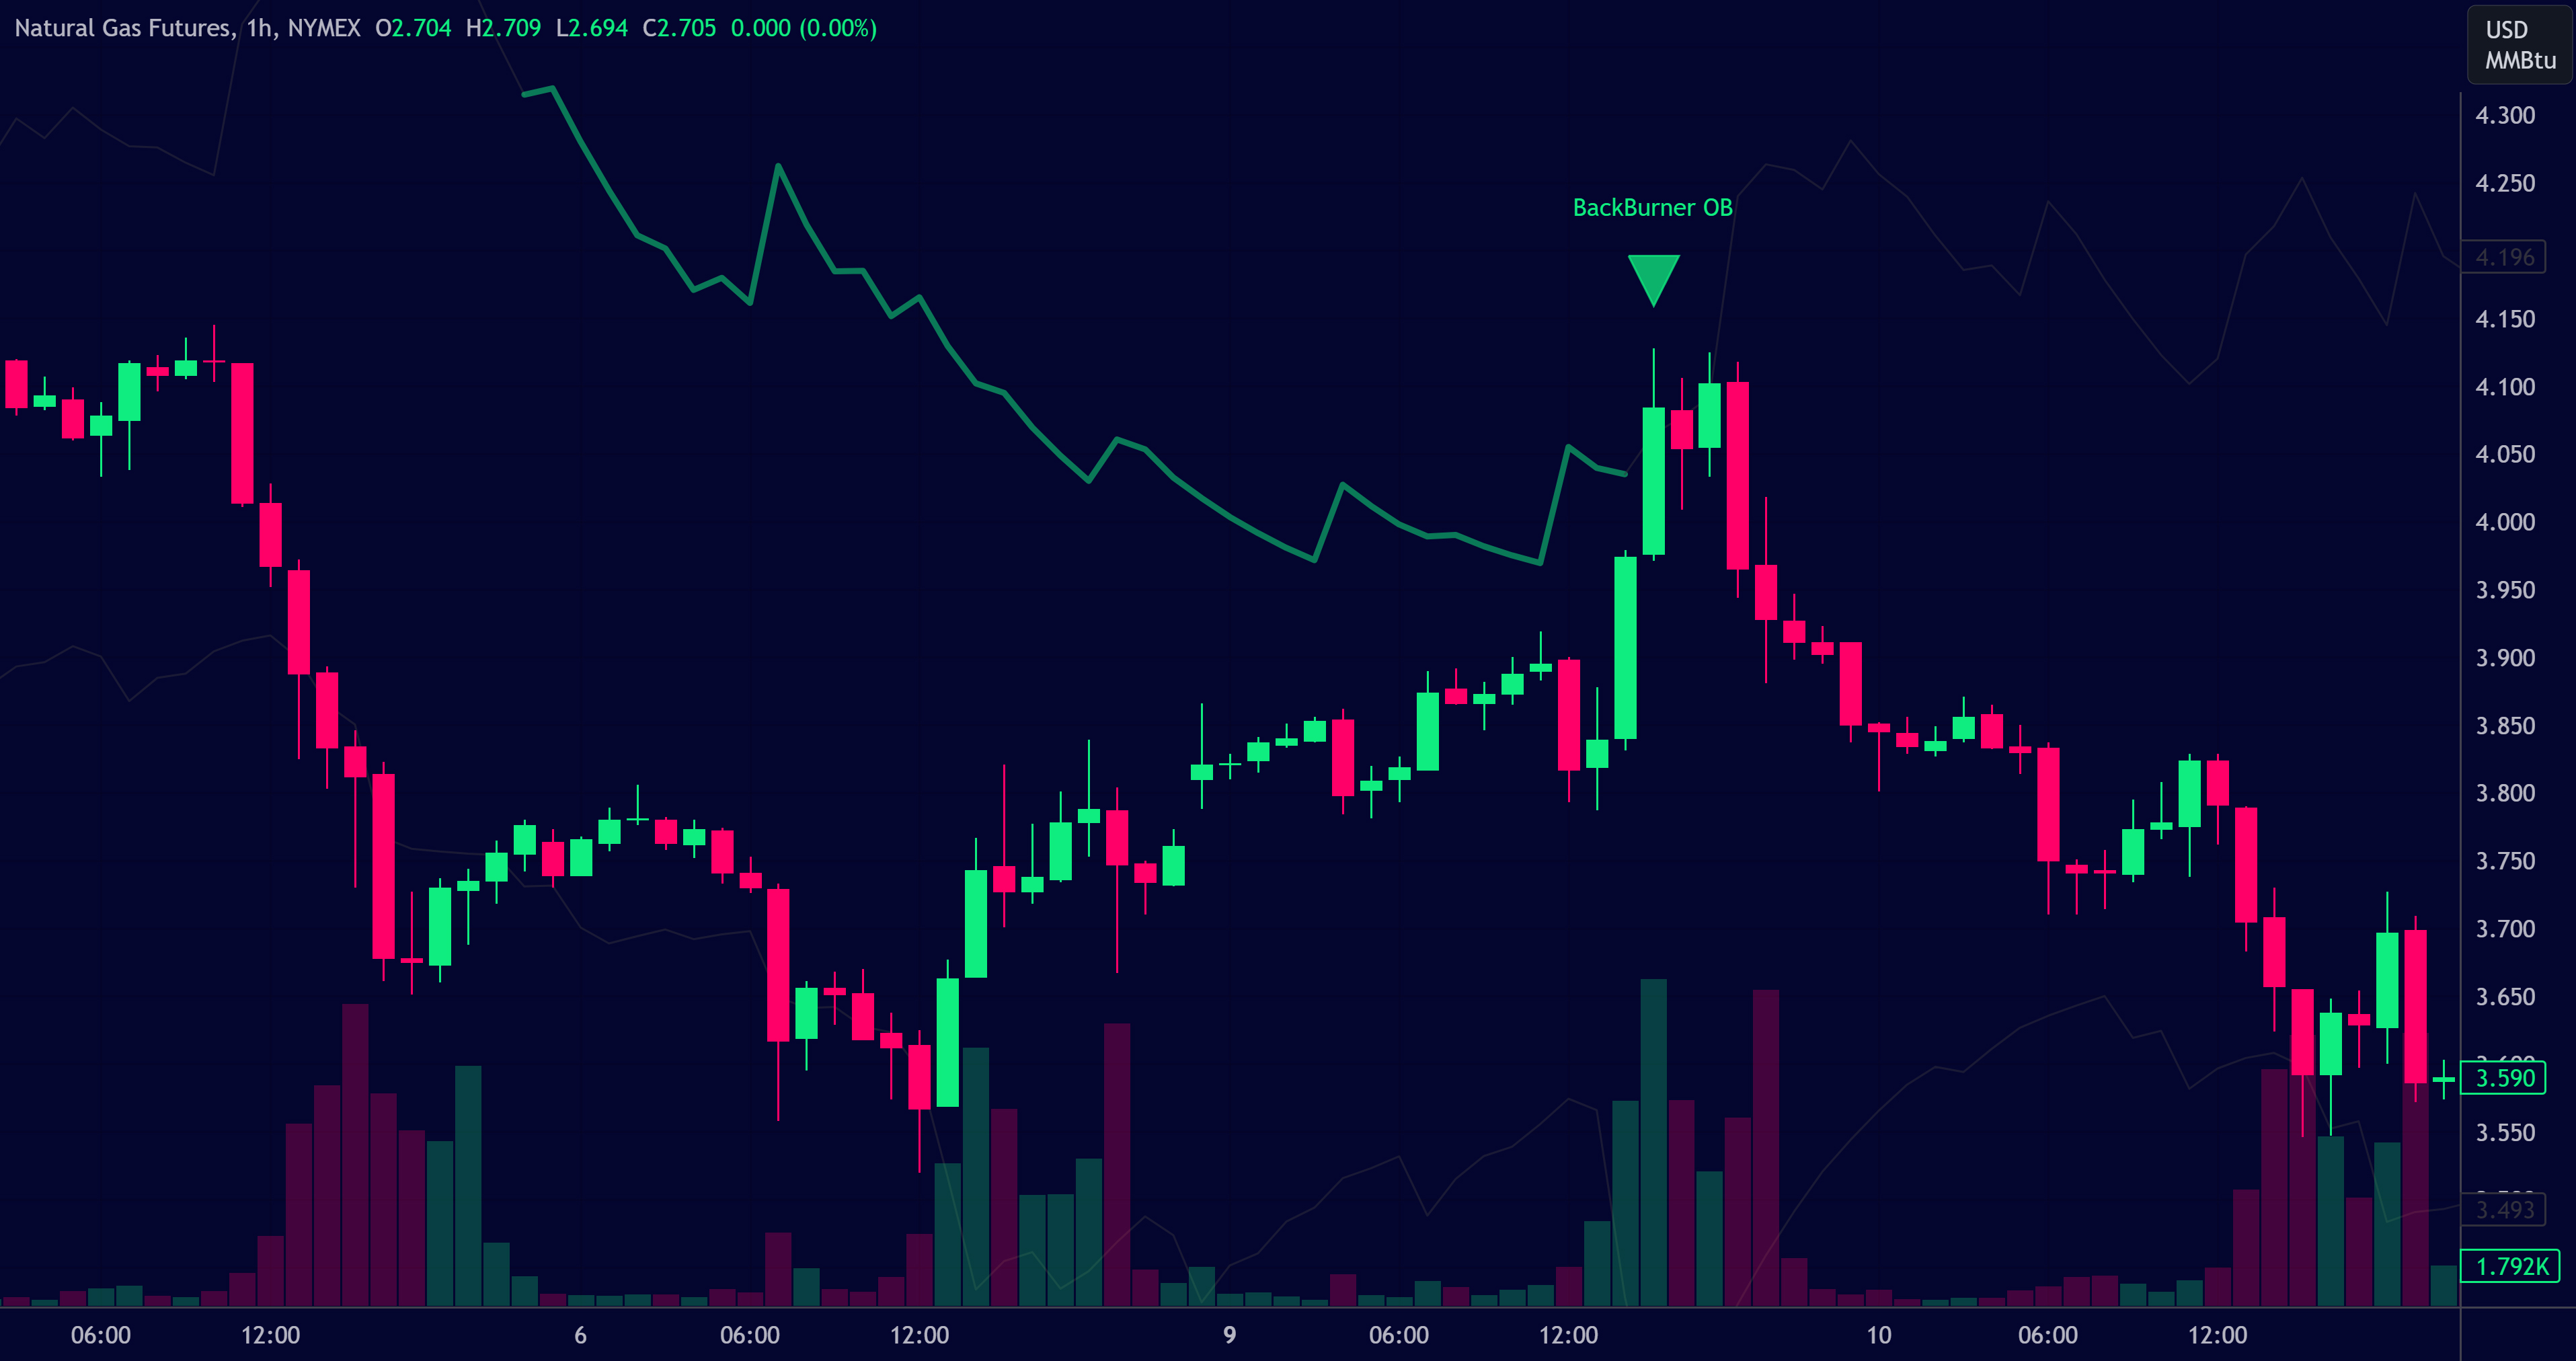
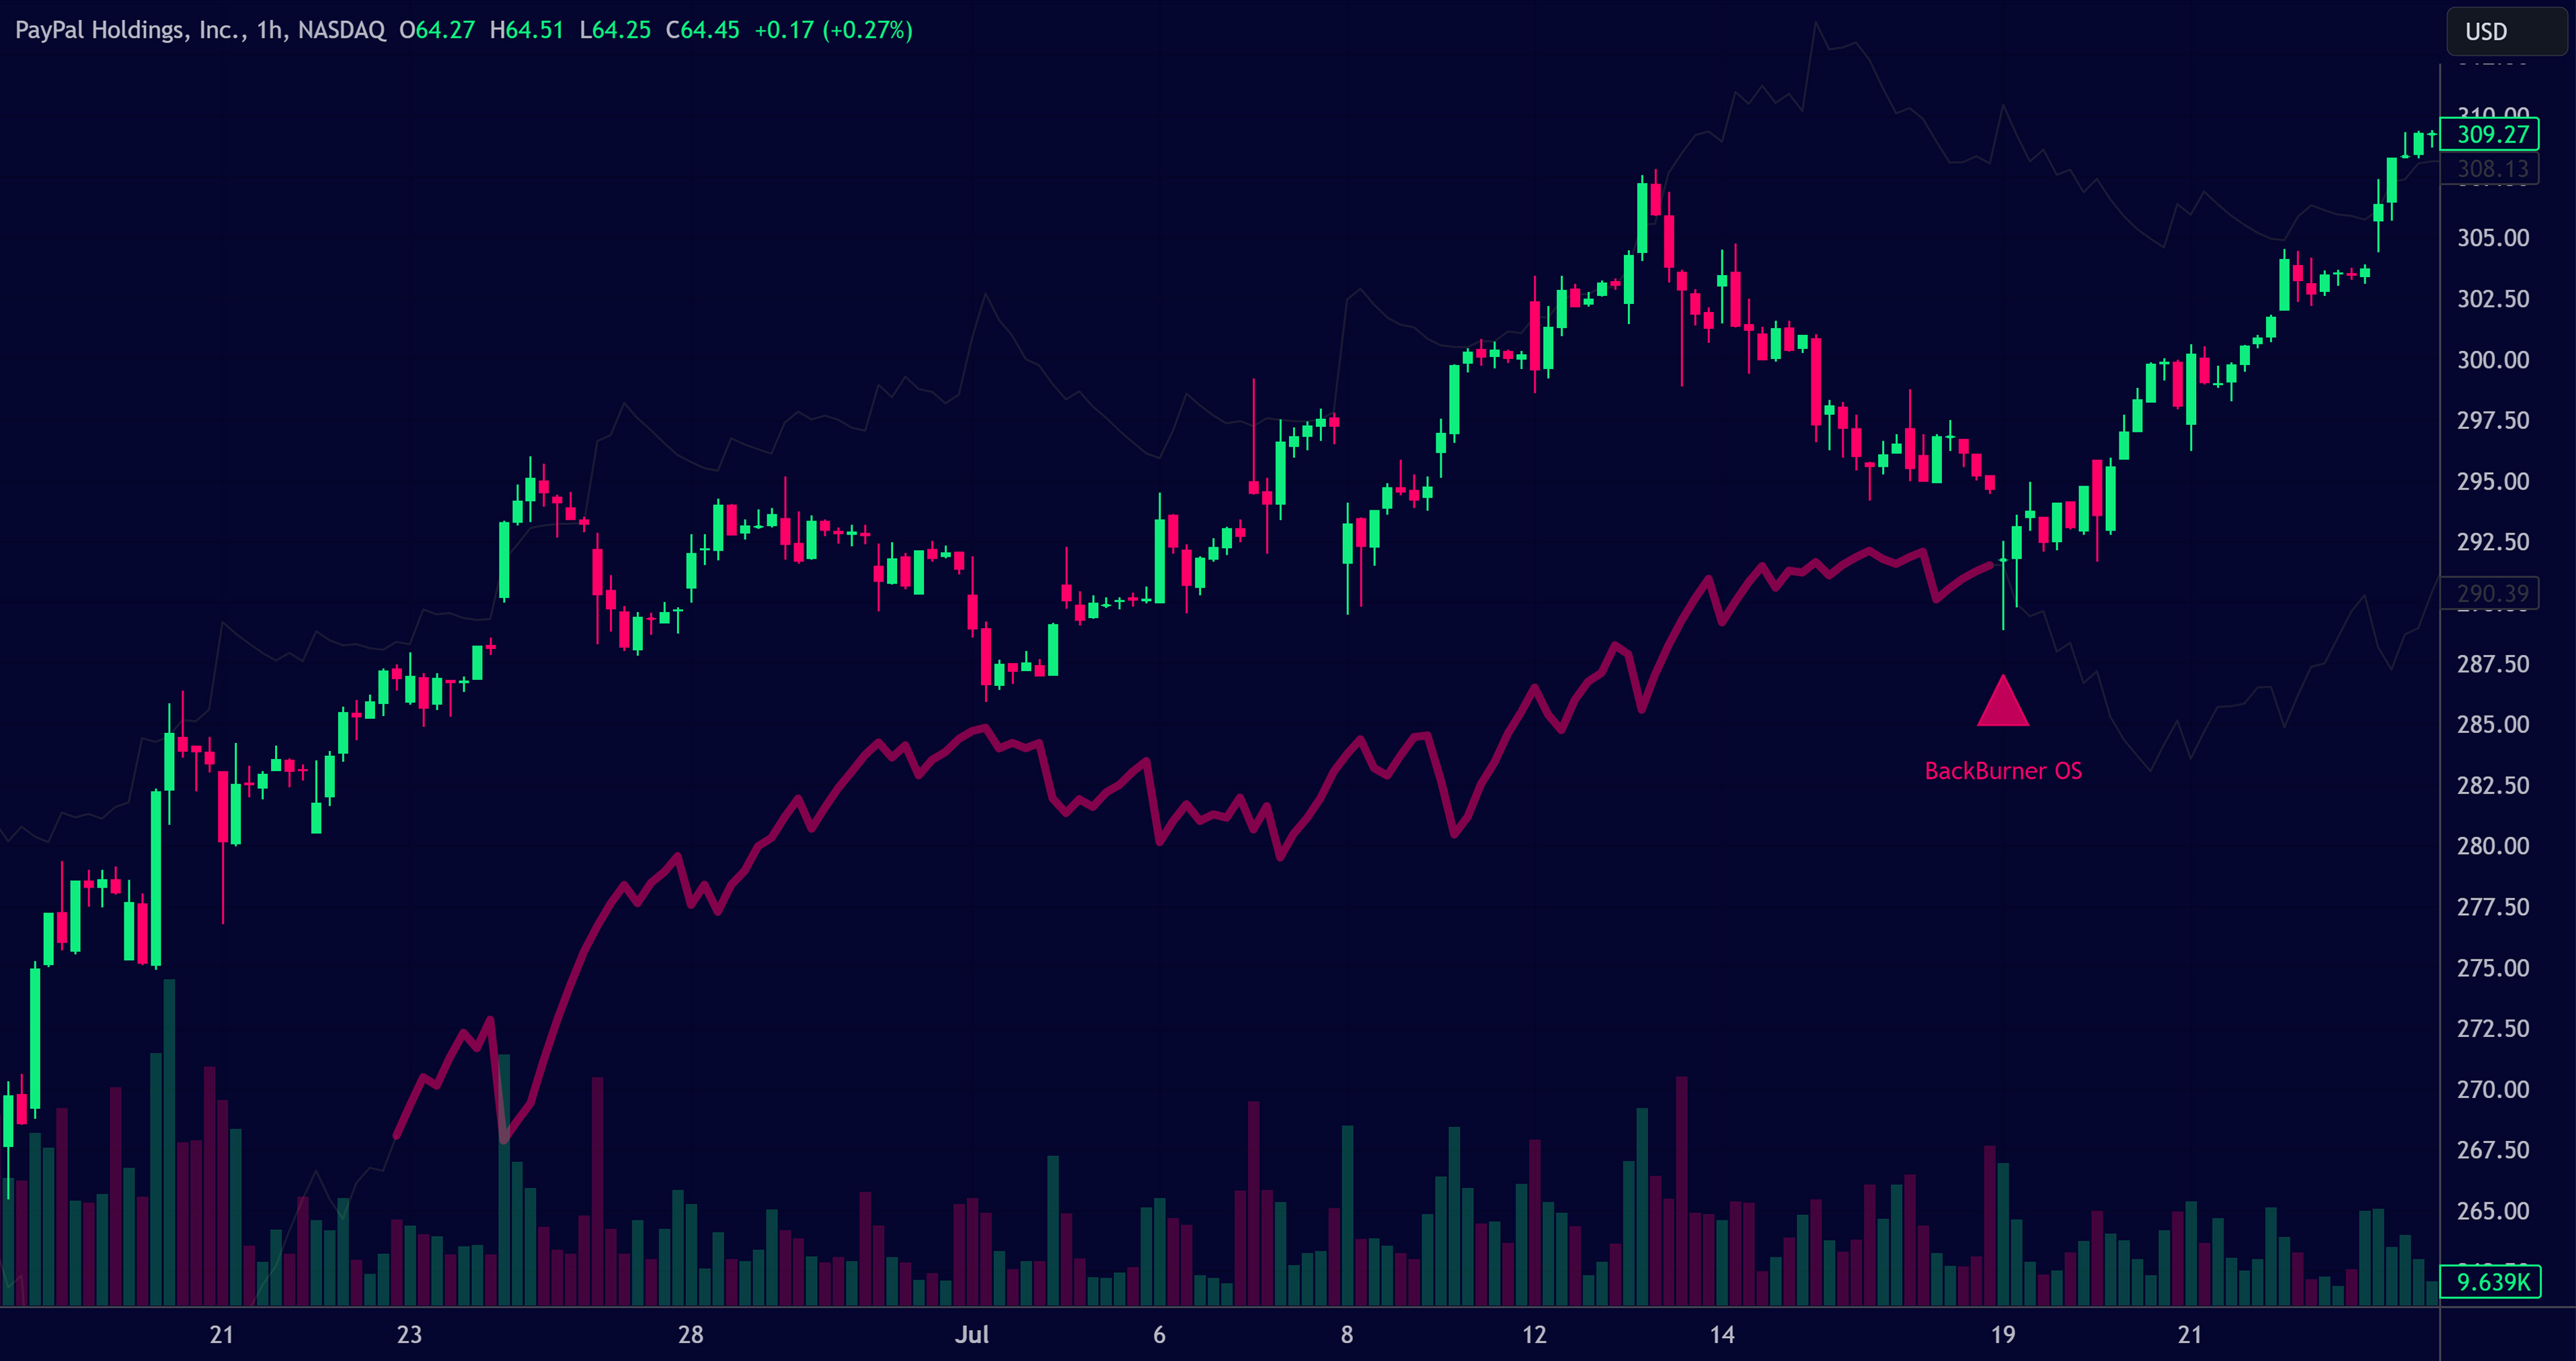
NG
Here we see NATGAS starting with a significant downside move that results in a small bounce before the hourly downtrend continues to the downside. As trend traders know, there are always periods where the price reaches exhaustion and begins to reverse course, developing a period of counter-trend consolidation. In this chart, this develops as an hourly uptrend, with the first low occurring at 12:00 and the second low confirming around 1800. With the counter trend now in place, the price starts to climb on the hourly chart, counter to the daily downtrend. The end result is that price closes the distance to the active BackBurner line, getting closer and closer to overbought conditions. Bulls then proceed to breakout on the 9th at approximately 13:00, exhausting short term bulls and triggering the BackBurner Overbought alert before reversing course back into the direction of the prevailing trend.
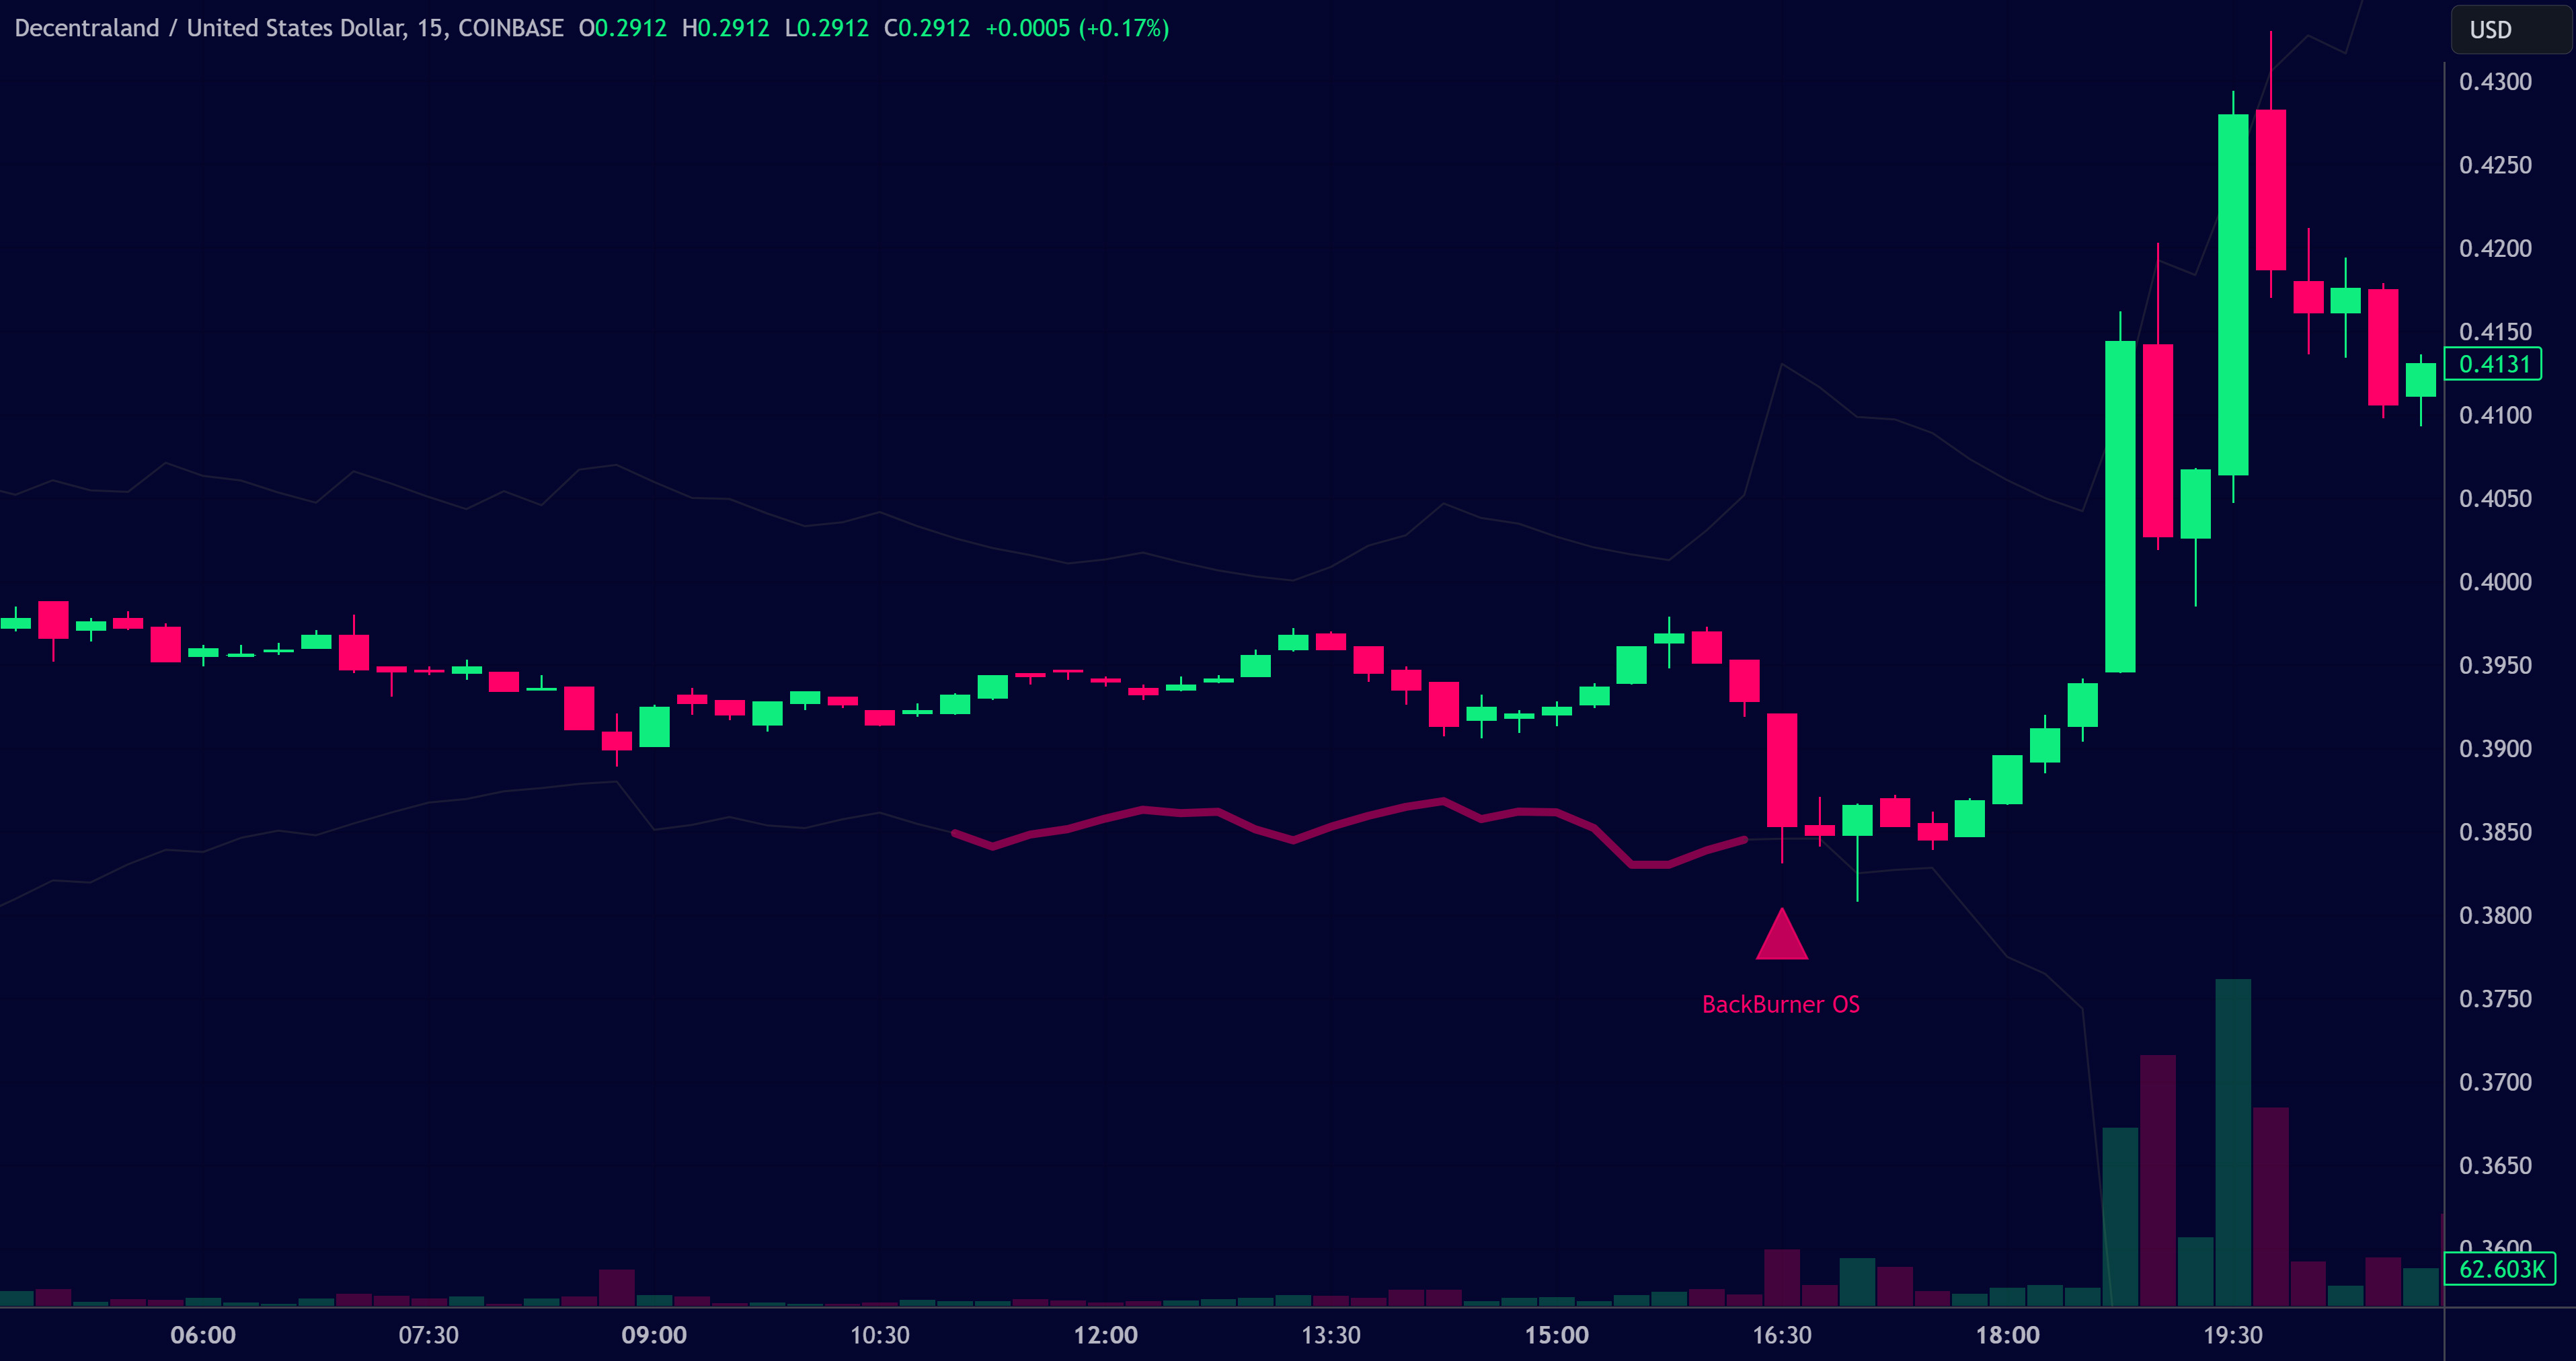
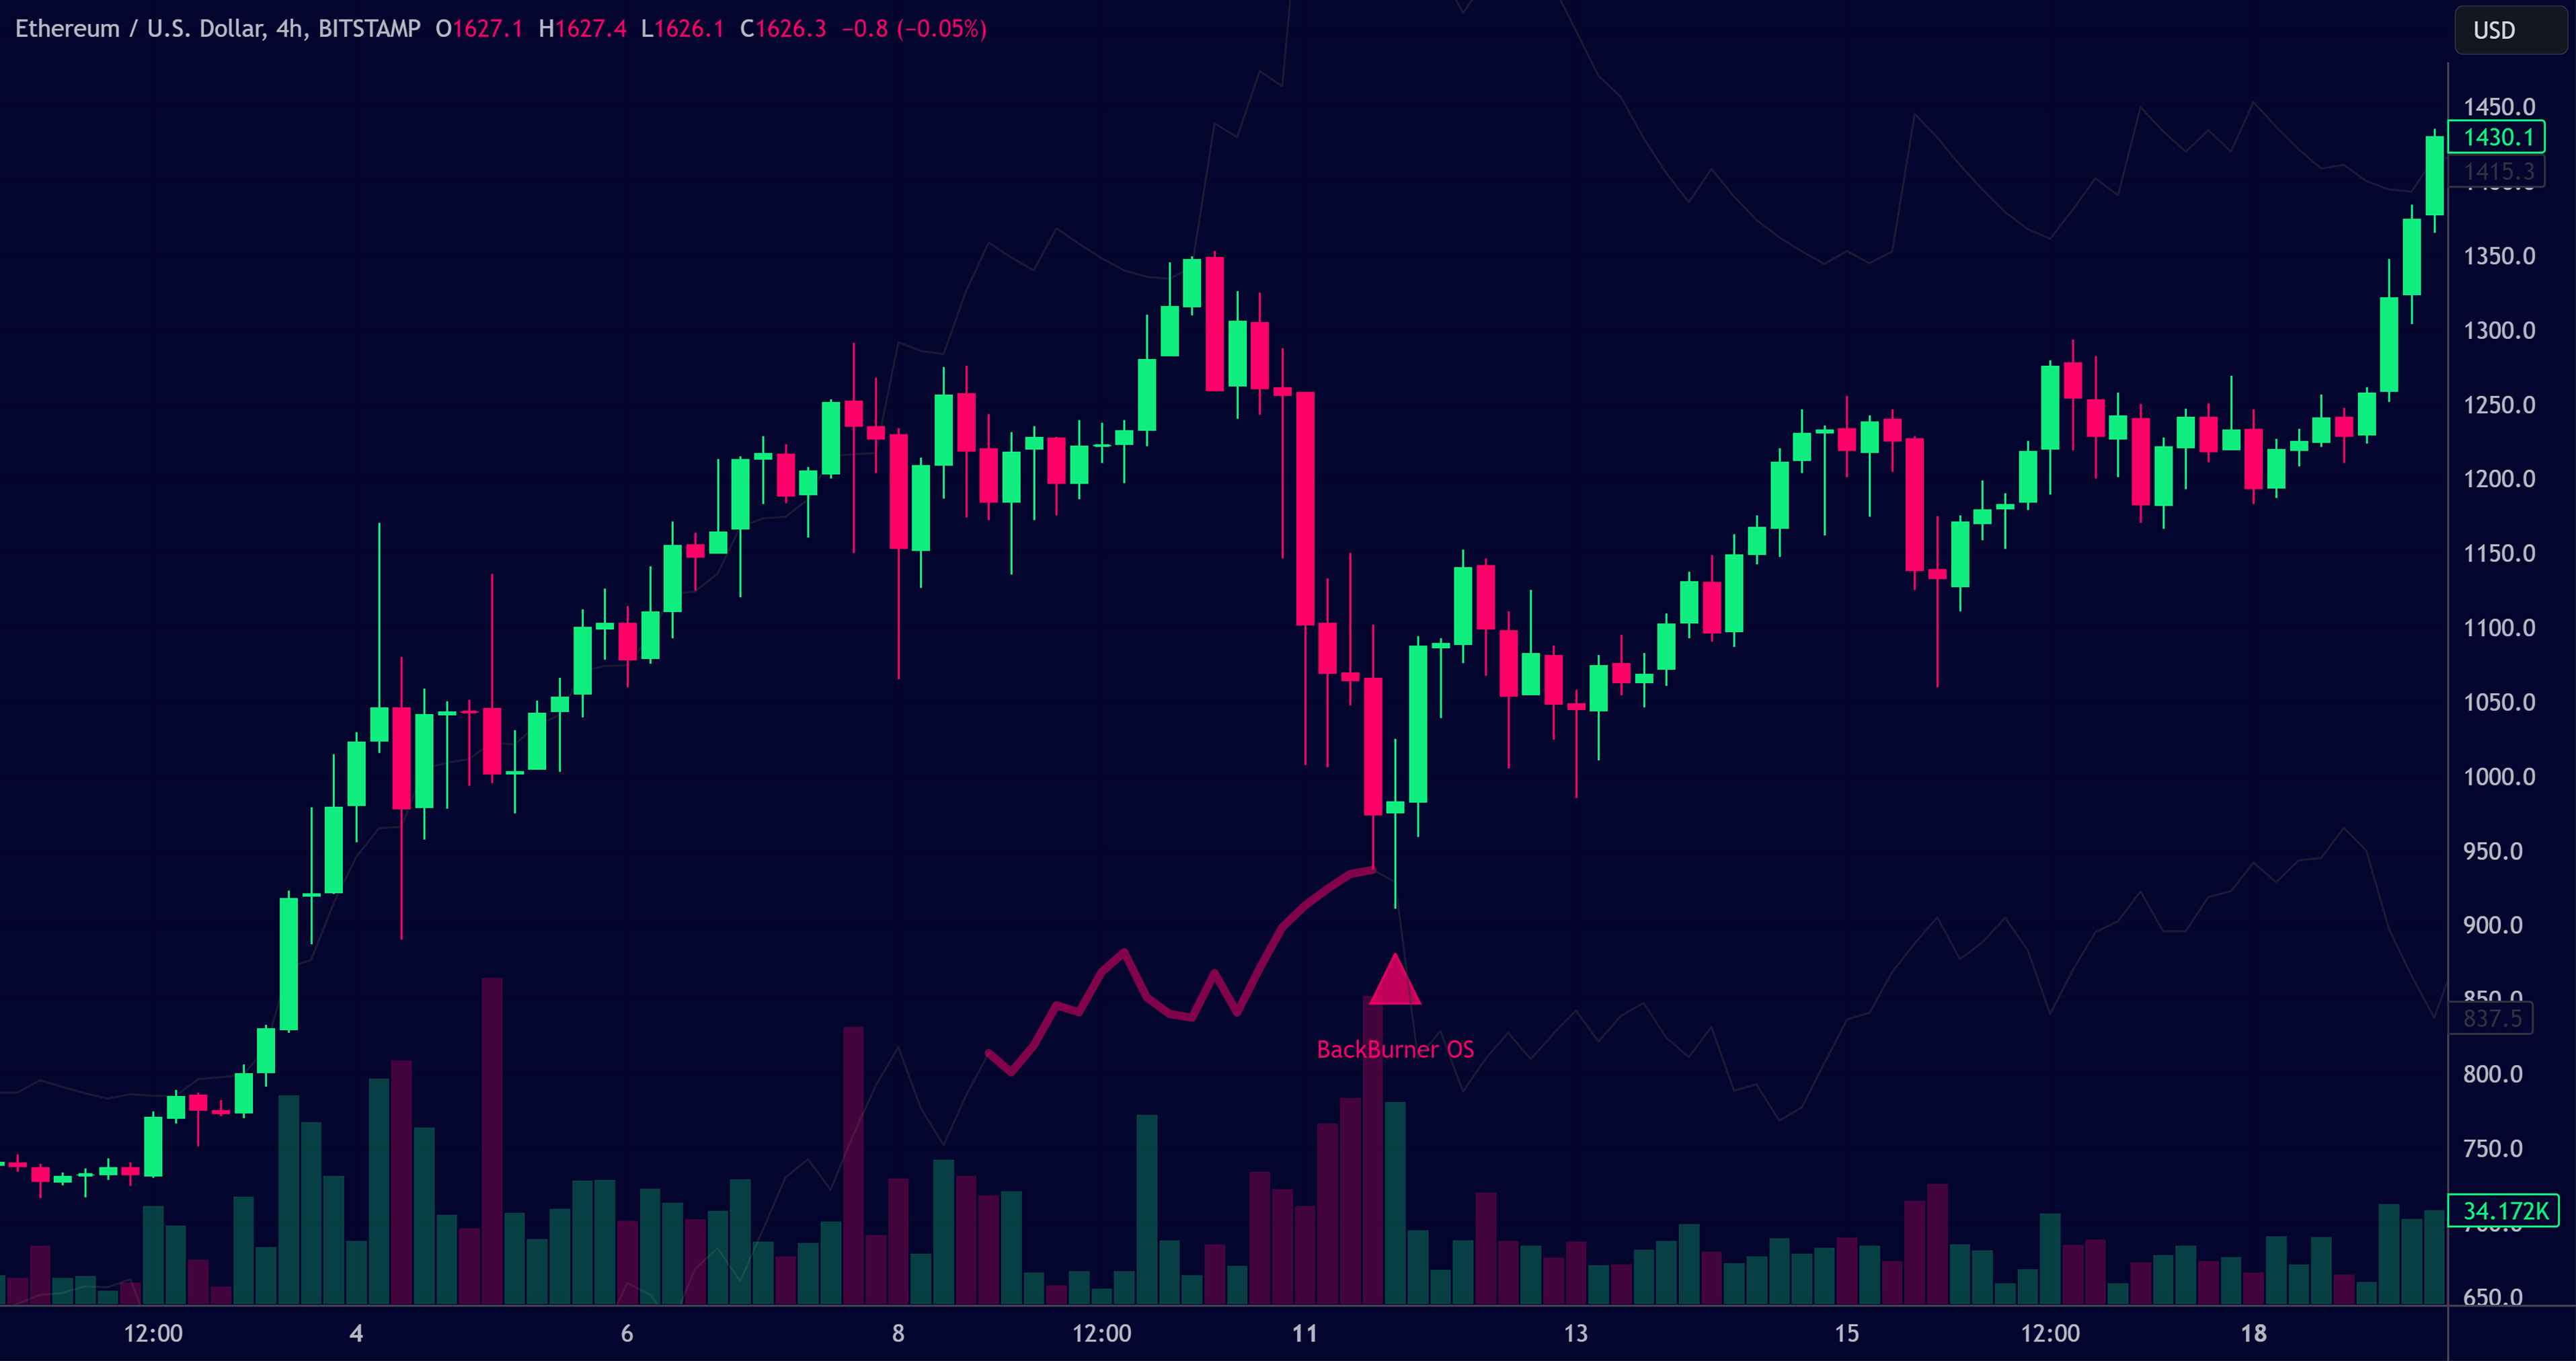
MANAUSD
In this chart we see an example of a classic BackBurner setup on the 15min MANAUSD chart. Looking from the left to right on the chart, we see the 15 min timeframe start with a period of balance that typically follows rapid increases in price. This balance breaks to the downside initiating a period of consolidation with the bears eventually able to apply enough pressure to push the RSI into oversold territory. What makes this trade significant is the presence of the red line under the price action which indicates that the prevailing trend on the larger timeframe is bullish and there is enough momentum in the overall trend to be scouting short term extremes. Once the BackBurner alert fires the price reverses course in line with the prevailing trend and price continues to climb to new highs.