
The Indicator that transforms the way you perceive market trends and extremes!
Grasping the significance of RSI extremes has always been crucial for traders. The challenge lies in accurately identifying these pivotal moments in the market. That's where the TCG Historical RSI comes into play.
The essence of the Historical RSI is straightforward: to offer you a clear picture of the market's strength and potential turning points. It achieves this by meticulously tracking and highlighting critical historical RSI trends and extremes, ensuring you're always one step ahead in your trading game.

-
Personal Breakthrough!
 I was always hesitant about relying on RSI for breakouts, everyone says RSI doesn't matter in extremes. The Historical RSI changed that for me, giving me a clear view of what has happened before. It's like having roadmap for market extremes!
 -
A New Perspective on RSI
Before the Historical RSI, RSI readings were just quick oversold or overbought signals to me. Now, they are powerful insights that inform guide my trading decisions in volatile conditions. -
A Must-Have Indicator
The clarity and depth of analysis provided by the Historical RSI are unmatched. It's not just an indicator; it's an tool that gives you perspective that you just don't get anywhere else.
What is the TCG Historical RSI Indicator?
Using the Historical RSI is a seamless experience. Once activated, the indicator vividly marks historical RSI highs and lows, along with recent extremes, using color-coded ranges. This visual simplicity, combined with its depth of data, makes the Historical RSI an indispensable tool for traders keen on leveraging RSI extremes in their strategies.
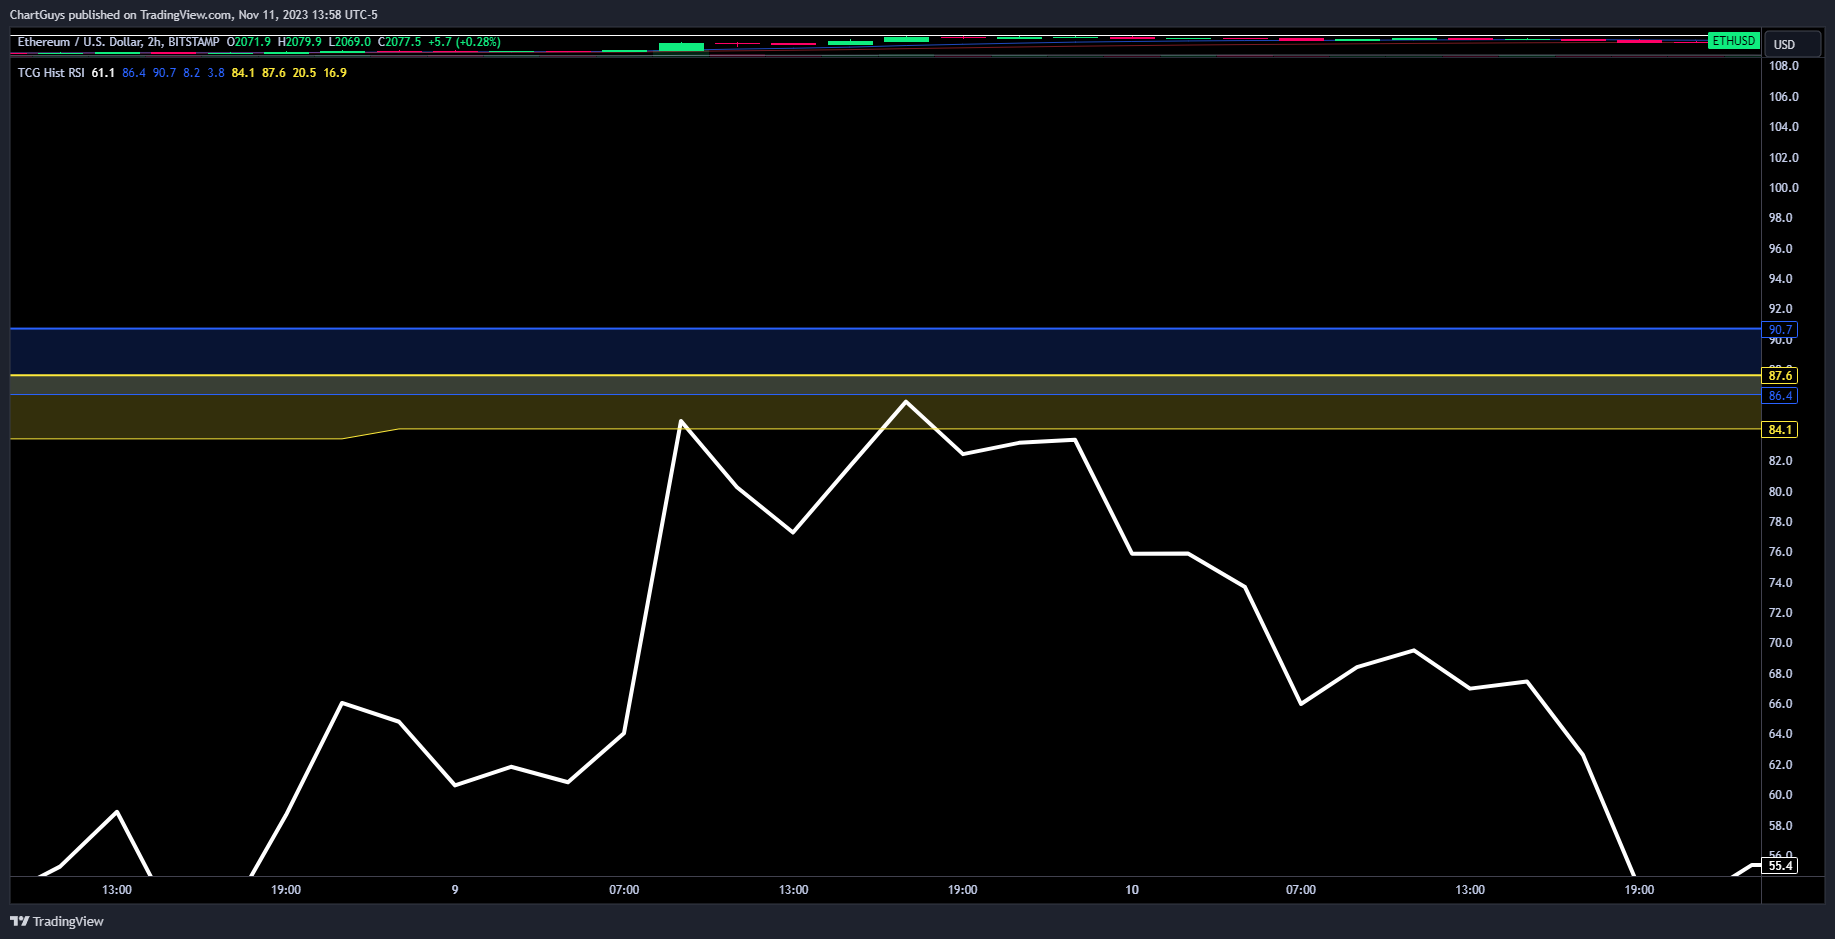
In this example we can see the current RSI breaking into the historical extreme range. Never in history has the RSI exceeded this limit.
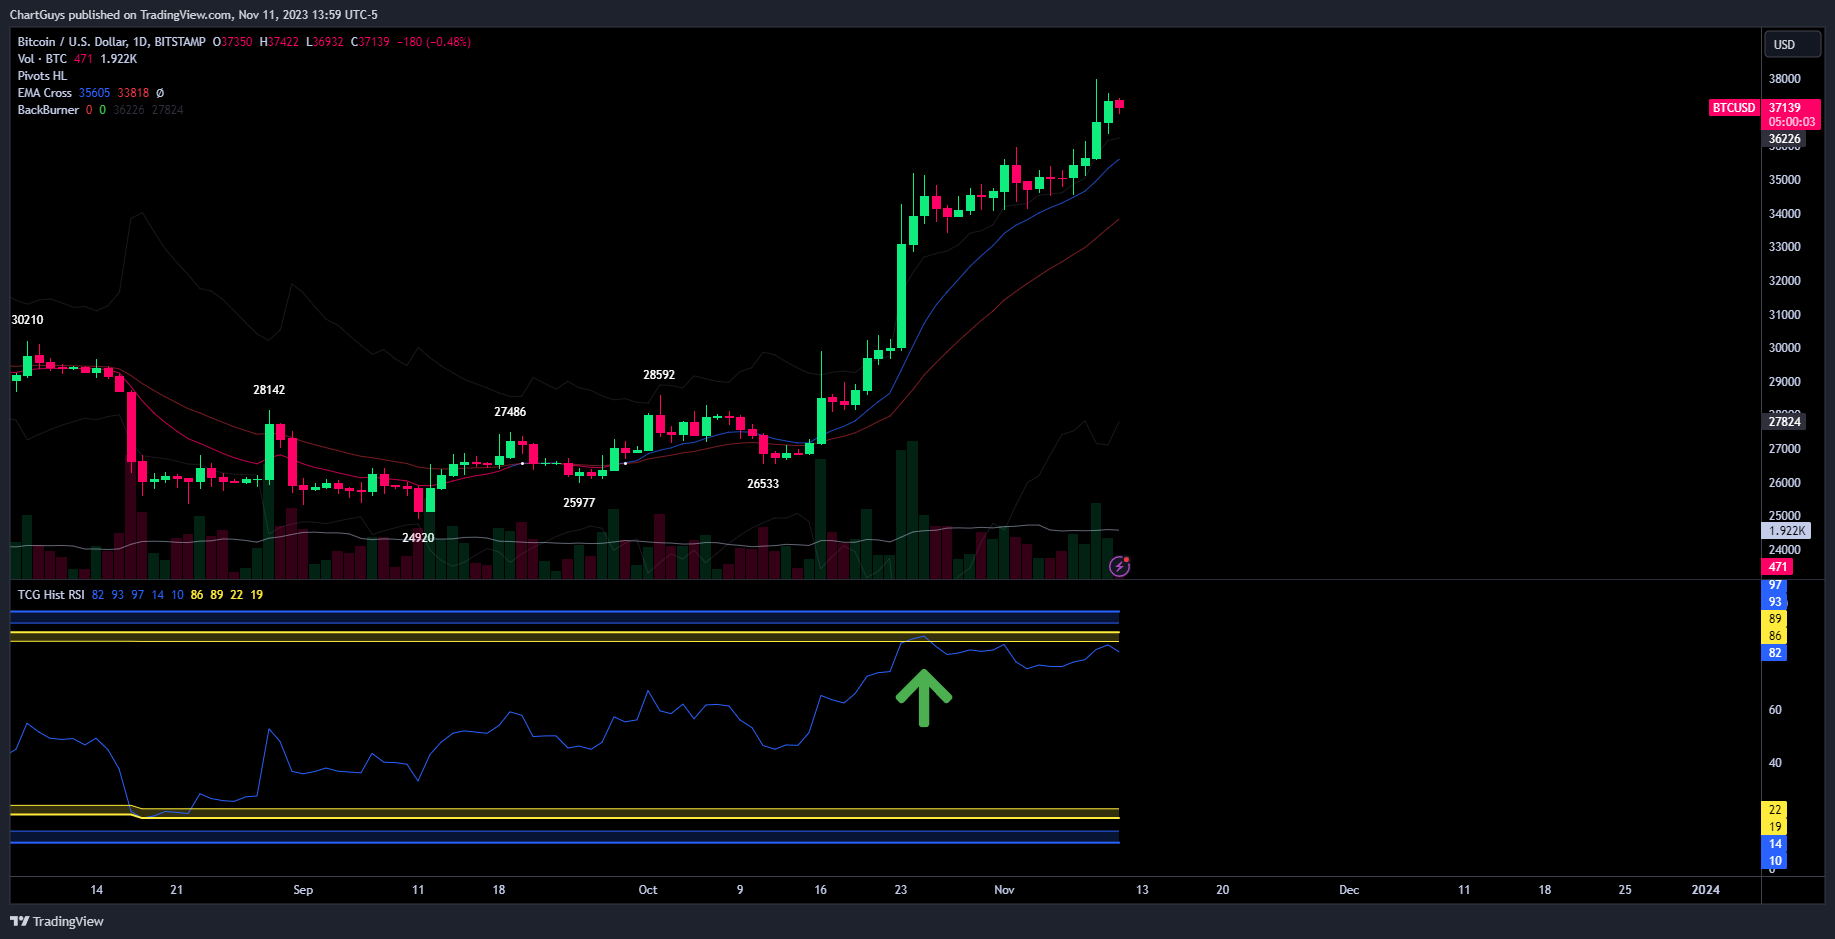
This indicator is best used to identify periods in which an extreme period of price action may be reaching its final push. In this example, Bitcoin experienced a significant daily breakout, pushing its RSI to an extreme level of 87. While a regular RSI reading at this level may appear overly stretched and offer limited insight, our advanced indicator provided a crucial edge. It identified that historical RSI levels were nearing, signaling that the breakout was approaching its completion. This insight enabled traders to anticipate market movements more accurately and make informed decisions about the timing of their trades
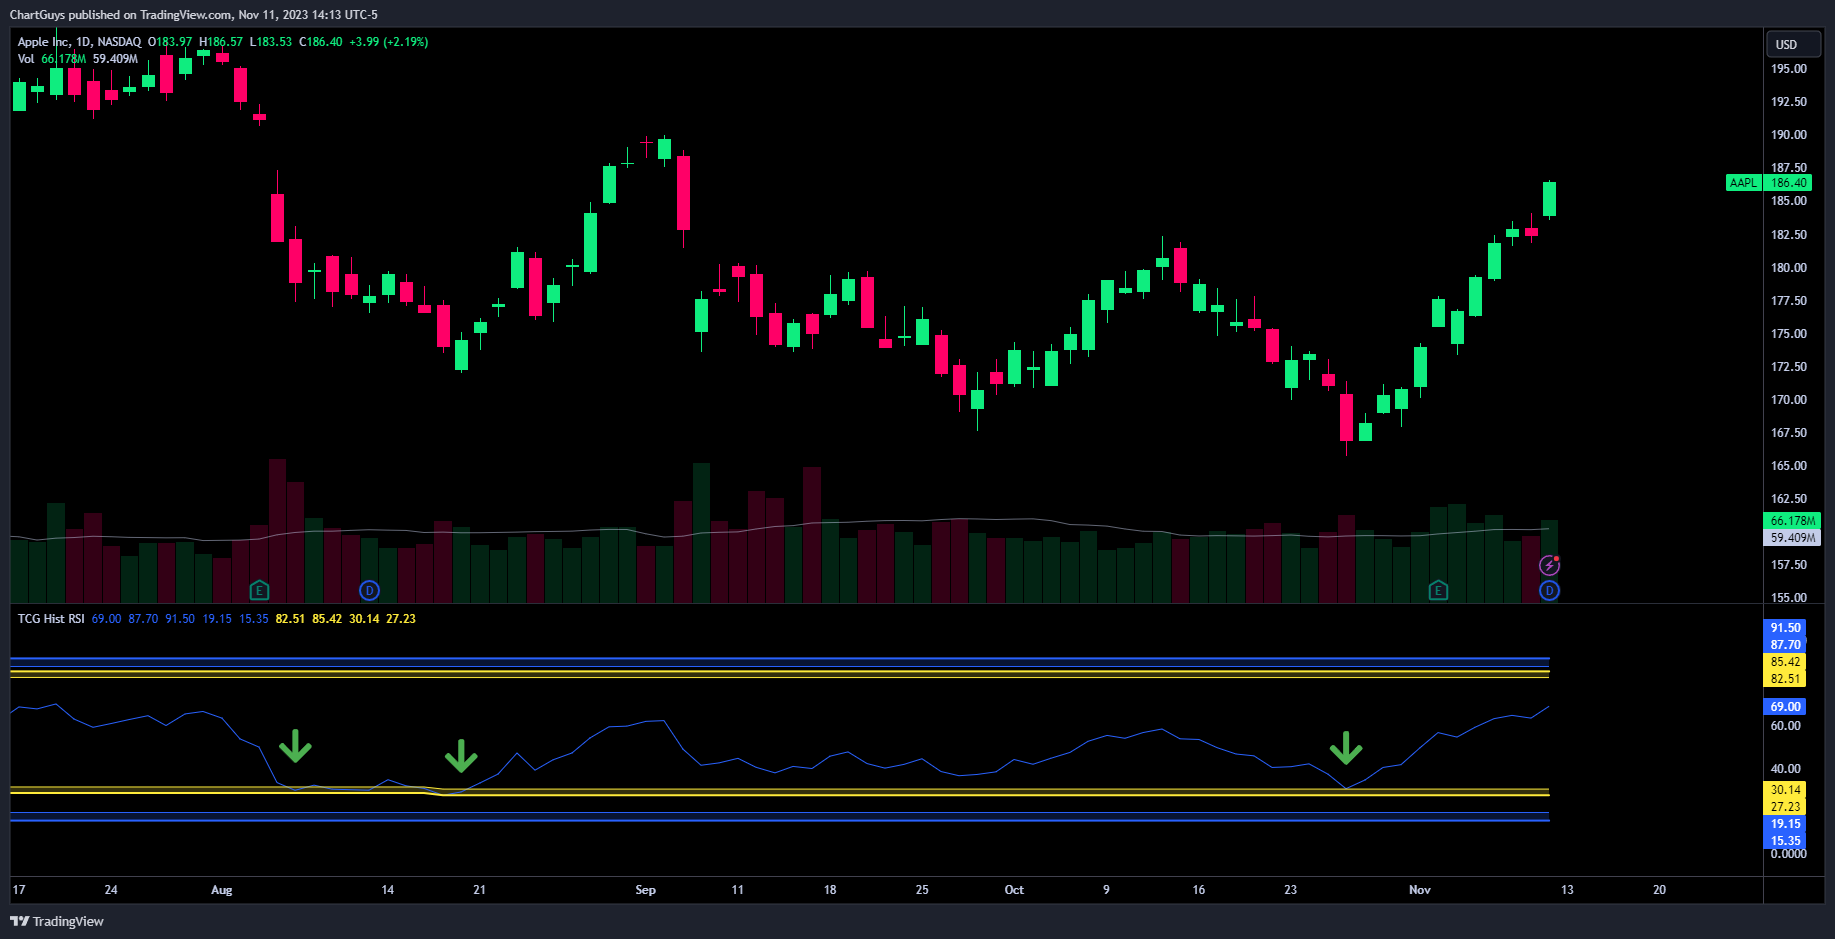
This indicator is equally useful in periods of market weakness. In the fall of 2023, our indicator skillfully pinpointed a key moment in Apple's (AAPL) stock performance. As AAPL approached its lowest levels, the tool identified these as temporary bottoms within the broader trend. This was particularly noticeable on October 26, where it accurately marked the lowest point before a significant change in direction. Subsequently, Apple's stock rebounded, registering an impressive 13% increase. This instance underscores the indicator's ability to provide insightful and timely signals, even in challenging market conditions, helping traders to identify potential turning points with greater confidence.
